 One Community
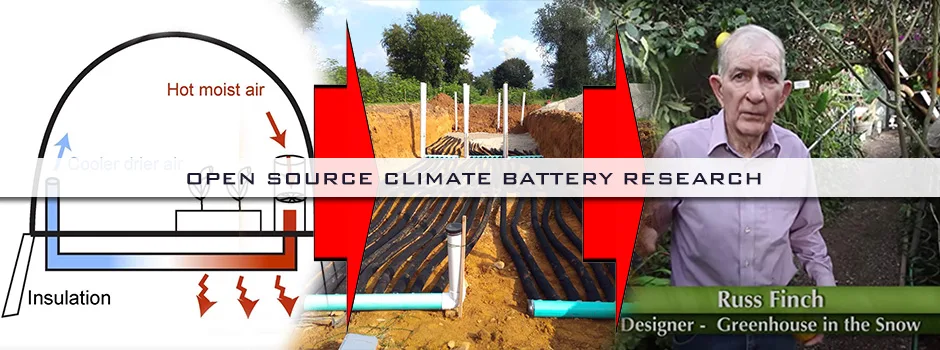
Open Source Climate Battery Design
A climate battery is a low-tech heating system consisting of a series of underground tubes to transfer heat beneath the floor of a structure, where it is “stored” for later use. This page is an open source hub for how to construct one. It discusses climate batteries with the following sections:
- What We’ll grow (click for complete page)
- What is a Climate Battery?
- Why Open Source a Climate Battery?
- Ways to Contribute
- Consultants on these Designs
- Climate Battery Design Elements/Considerations
- Designing For Heating
- Designing for Ventilation
- Validation
- Stress – Strain Calculation
- Thermal Simulation
- HVAC Analysis for Temperature Maintenance
- One Community’s Climate Battery Design
- Maximally-affordable Walipini Greenhouse Design Elements and Plans
- Cost Analysis
- Resources
- Summary
- FAQ
NOTE: THIS PAGE IS NOT CONSIDERED BY US TO BE A COMPLETE AND USABLE TUTORIAL UNTIL WE HAVE OUR CLIMATE BATTERIES COMPLETED AND TESTED AS PART OF THE CONSTRUCTION OF OUR WALIPINI DESIGNS.
AT THAT TIME WE WILL ADD HERE THE COMPLETED PLANS AND EVERYTHING ELSE WE LEARNED.
IN THE MEANTIME, WE WELCOME YOUR INPUT AND FEEDBACK
RELATED PAGES (Click icons for complete pages)


")


WHAT IS A CLIMATE BATTERY?
 A climate battery is a heating and cooling system that uses forced air and low-temperature geothermal energy. Also known as a “heat bank” and/or “thermal banking”, it works by circulating air through rows of underground tubes where the earth temperature regulates the humidity and temperature of the air, reducing the need for external heating or cooling. It’s called a climate “battery” because of the system’s capability to store heat from the incoming hot moist air and expend it when needed.
The image below represents the concept of the battery design, where hot, moist air is drawn through a pipe outlet and transferred through the underground piping system. As the air moves through the pipes, heat exchange occurs with the earth’s cooler temperature, resulting in cooler, drier air exiting from the other outlet.

Passive Solar for Heating and Air Treatment – Click for source
EXAMPLES OF WORKING CLIMATE BATTERIES
Here’s a 2-minutes video of climate battery maintained passive greenhouse in Nebraska:
Here is a 20-minute more detailed version and a PDF download with additional details:

Here’s another walipini example from Colorado. It includes a few other sustainable heating options too:

WHY OPEN SOURCE A CLIMATE BATTERY?
One Community began researching climate batteries for use as part of our Aquapini/Walipinis and Tropical Atrium. We are open sourcing the research and our designs to encourage others to build their own climate battery. An open source model also allows for discussion, experimentation and innovation which will lead to better systems and ultimately provide a more reliable, efficient, and sustainable heating and cooling solution for greenhouses, homes, and non-residential buildings alike.
WAYS TO CONTRIBUTE TO EVOLVING THIS SUSTAINABILITY COMPONENT WITH US
SUGGESTIONS | CONSULTING | MEMBERSHIP | OTHER OPTIONS
CLICK HERE TO HELP US FINISH THE OPEN SOURCE DESIGNS FOR THESE STRUCTURES
CONSULTANTS ON THESE OPEN SOURCE DESIGNS THAT ARE COMING
Aravind Vasudevan: Mechanical Engineer
Diana Gomez: Mechanical Engineer
Dirgh Patel: Volunteer Mechanical Engineer
Henry Vennard: Mechanical Engineer
Jagannathan Shankar Mahadevan: Mechanical Engineer
Julia Meaney: Web and Content Reviewer and Editor
Mohammad Almuzaial: Civil and Construction Engineer
CLIMATE BATTERY DESIGN ELEMENTS/CONSIDERATIONS
The following sections discuss the design elements and considerations for climate battery implementation. In order to build an efficient system that takes full advantage of your climate battery’s heating and cooling potential, you will want to pay close attention to these details and design accordingly.
- Air Flow Rate
- Climate Battery Tubing
- Soil
- Insulation
- Fan Selection
- Controls, Sensors, and Automation
- Designing for Heating
- Designing for Ventilation
- Solar Radiation Heat Gain Considerations
AIR FLOW RATE
The air flow rate within the climate battery will impact the heat transfer and the overall efficiency. Unfortunately, there has not been enough research on the optimal air flow rate to offer a specific recommendation. A study of Earth-air heat exchanger systems found that increasing the air velocity decreases the thermal performance of the system. At higher air velocity the air does not have enough time within the pipes to reach thermal equilibrium with the ground. However, the air should be moving fast enough to be in fully turbulent flow to increase the heat transfer rate. To find when the air flow becomes turbulent you will need to calculate the Reynolds number, an online calculator can be found here. Another method to find an appropriate air flow rate is to base it off of the recommended air change rate of the greenhouse, or how many times the entire volume of air in the greenhouse should be circulated per hour. Recommendations on the best air changes per hour (ACH) vary widely but we have found consistent recommendations within 5-10 ACH. More information on flow rate and fan sizing can be found in the fans section.
CLIMATE BATTERY TUBING
The major considerations for climate battery tubing are material, length, depth, diameter, and spacing. As a climate battery primarily consists of tubing with fans, each of these factors is important for efficiency. They will also be the primary drivers for cost.
MATERIALS CONSIDERATIONS
A common material for climate battery tubing is corrugated Advanced Drainage System (ADS) pipe. The tubing should also be perforated (designed with small slots or holes) to drain water built up from condensation. ADS is used because its characteristics make it an ideal material for geothermal uses. The pipes can be joined by heat, creating leak-proof fusion joints. They are also flexible and durable (very high stress resistant). It is important to follow the installation specifications provided by the manufacturer.
TOTAL LENGTH CONSIDERATIONS
The total length of the tubes that form the climate battery will be determined based on two main considerations. The first one is the optimal heat exchange between the earth and the air, which tends to increase with the length. The second one is the cost of installation and fan energy consumption, both of which also increase with an increase in tube length.
A common recommendation for length is between 25 and 35 feet. However, because the optimal length will change depending on the specifics of your climate battery, no clear recommendation can be made for general use. The tubing length should be matched with the selected fans to ensure that they can push air efficiently. More information on this can be found in the fans section.
DEPTH CONSIDERATIONS
Important considerations for the burial depths of the climate battery tubing include:
- The temperature variation of the soil.
- The water table.
- The increase in the resources needed to install the system.
THE TEMPERATURE VARIATION OF THE SOIL
Data on the temperature variation of the soil in the United States can be found from the Soil Climate Analysis Network (SCAN). This dataset is collected by the United States Department of Agriculture from multiple locations around the country. One Community’s open source thermal lag research is also a good source for better understanding of soil temperatures.
If there is no data available, then you can use the approximation that 1.5-2 meters into the ground, the temperature remains constant throughout the year at the local annual average temperature. Other sources recommend shallower depths, anywhere from 2-4 feet, as long as the tubes are buried above the water table.
Research suggests that even deeper burial depths may be more effective. The figure below, obtained from the computational model developed by Da Silva et al, shows the variation of the outlet temperature of a climate battery (called an Earth-Air Heat Exchanger in the paper) throughout a year for 5 different burial depths. For our purposes, the greater the difference between inlet and outlet temperature, the better. The best results are observed for 5 meters (16.4 ft), however, we can observe that for burial depths between 3m and 5m (9.8ft and 16.4ft) the differences are only 1°C – 3°C. Therefore, a burial depth of 3m (9.8ft) would be adequate. See the section on soil for additional information regarding the influence of soil type, burial depth, and water content.

Variation of the Outlet Temperature of a Climate Battery Over a Year With Varying Depths
THE WATER TABLE
Your water table is another important consideration. As stated above, your climate battery must be buried above the water table. This is important because burying the system below the water table will mean that it is sitting in completely saturated soil. This soil will have drastically different thermal properties compared to unsaturated soil and will not store heat as effectively. To determine your water table you can access a public database or directly measure a shallow well. Databases include: the USGS Groundwater Data for the Nation and the National Ground-Water Monitoring Network.
INCREASED RESOURCES TO INSTALL YOUR SYSTEM
How deep you install your system will affect the resources required for your climate battery. An increase in depth will also increase the cost of your system as you’ll need to pay for deeper excavation and more tubing. Excavation costs vary between companies, but you can expect to pay between $50-$200 per cubic yard of dirt.
TUBING/PIPING DIAMETER CONSIDERATIONS
The diameter of the tubing is important because it will affect the flow velocity and heat transfer. Turbulent flow with a Reynolds number (Re) > 4000 is ideal for heat transfer. As seen below, the Reynolds number of a fluid depends on the viscosity of the fluid (a fluid’s resistance to flow), the speed of flow, and the diameter of the pipe.
The Reynolds number equation for flow in a pipe can be expressed in equivalent ways depending on the known parameters. It can be calculated by multiplying the fluid density (ρ), mean velocity (u), and pipe hydraulic diameter (DH), then dividing by the fluid’s dynamic viscosity (μ). Alternatively, it can be determined by multiplying the mean velocity (u) and hydraulic diameter (DH), then dividing by the kinematic viscosity (ν). It may also be expressed by multiplying the volumetric flow rate (Q) and hydraulic diameter (DH), then dividing by the product of pipe cross-sectional area (A) and kinematic viscosity (ν). Finally, it can be calculated by multiplying the mass flow rate (W) and hydraulic diameter (DH), then dividing by the product of pipe cross-sectional area (A) and fluid dynamic viscosity (μ).

Reynolds Number Equation – Click for source
That being stated, you can generally use whatever diameter you want, as long as you get turbulent flow. However, 4in diameter tubing seems to be standard throughout the different climate batteries. The airspeed for 4in tubing should be greater than 125 fpm (0.635 m/s).
TUBING/PIPING SPACE CONSIDERATIONS
Little research exists around the optimal spacing between tubes. It is suggested to give 9-12 inches (.2286 m – .3048 m) between each tubing exchange layer.
SOIL
Soil types also play an important role in the climate battery system. Different types of soil have different compositions and hold different amounts of water, and therefore, they have different thermal conductivity levels. It is important to keep the thermal conductivity of soil in mind when building underground and/or constructing climate batteries. Below is a chart for understanding the thermal conductivity differences of various soil types.

It is recommended that the soil be no more than 25% clay, as too much clay will build up an insulating layer around the pipes and limit heat transfer. If the soil has greater than 25% clay, mix the native soil with sand or a soil with low clay content and backfill the excavated areas with this new mix to improve heat transfer away from the pipes. A sandy loam soil is considered a great choice for climate batteries because of its thermal properties and nutrient content for plant growth (beneficial in cases of climate batteries being built below greenhouse structures).
SOIL TEMPERATURE
Soil temperature varies from month to month as a function of incident solar radiation, rainfall, seasonal swings in overlying air temperature, local vegetation cover, type of soil, and depth in the earth. Due to the much higher heat capacity of soil relative to air and the thermal insulation provided by vegetation and surface soil layers, seasonal changes in soil temperature deep in the ground are much less than, and lag significantly behind, seasonal changes in overlying air temperature. Thus in spring, the soil naturally warms more slowly and to a lesser extent than the air and by summer, it becomes cooler than the overlying air and acts as a natural sink for removing heat from a building. Likewise in autumn, the soil cools more slowly and to a lesser extent than the air and by winter, it is warmer than the overlying air and acts as a natural source for adding heat to a building. See One Community’s open source thermal lag research on Thermal Lag for a deeper understanding.
At soil depths greater than 30 feet below the surface, the soil temperature is relatively constant and roughly corresponds to the water temperature measured in groundwater wells 30 to 50 feet deep. This is referred to as the “mean earth temperature.” Figure 1 shows the mean earth temperature contours across the United States. In Virginia, the mean earth temperature ranges from 52º F in the northern Shenandoah Valley and Winchester area to 62º F in coastal Tidewater. Click here for the source of figures 1-4 below.

Figure 1. Mean Annual Earth Temperature Observations at Individual Stations, Superimposed on Well-Water Temperature Contours
The amplitude of seasonal changes in soil temperature on either side of the mean earth temperature depends on the type of soil and the depth below the ground surface. In Virginia the amplitude of soil temperature change at the ground surface is typically in the range of 20-25º F, depending on the extent and type of vegetation cover. At depths greater than about 30 feet below the surface, however, the soil temperature remains relatively constant throughout the year, as shown below in Figure 2.

Figure 2. Amplitude of Seasonal Soil Temperature Change as a Function of Depth Below Ground Surface
Deeper soils not only experience less extreme seasonal variations in temperature, but the changes that do occur lag farther behind those of shallower soils. This shifts the soil temperature profile later in the year, such that it more closely matches the demand for heating and cooling. Referring to Figure 3, for example, the maximum soil temperature occurs in late August (when cooling demand is high) at a depth of 5 feet below the ground surface, but it occurs in late October (after the heating season has begun) at a depth of 12 feet below the ground surface.
Thus, a deeper ground loop installation would lower the annual operating cost of electrical energy for running the heat pumps. Over the life of a ground heat pump (GHP) system, these accumulated savings may more than offset the higher capital cost of burying the ground loop more deeply. In order to determine the optimal depth of burial, it is important to know how the seasonal changes in soil temperatures vary with depth; this is mainly determined by the soil’s thermal properties.

Figure 3. Seasonal Soil Temperature Change as a Function of Depth Below Ground Surface for an Average Moist Soil
SOIL THERMAL PROPERTIES
Heat capacity is the amount of heat required to raise the temperature of an object by 1 degree Celsius. For example, if a metal chair sits in the bright sun on a hot day, it becomes hot to the touch quite quickly. An equal mass of water under the same sun exposure will take longer to become nearly as hot. This means that water has a high heat capacity, i.e., the amount of heat required to raise the temperature of water is greater than a metal chair. The heat capacity of dry soil is about 0.20 BTU per pound per ºF of temperature change, which is only one-fifth the heat capacity of water. Therefore, moist or saturated soils have greater heat capacities, typically in the range of 0.23 to 0.25 BTU/lb/ºF. As shown in Figure 3 above, light dry soils experience greater seasonal temperature swings at a given depth than wet soils. This is because the water in the wet soil is able to maintain its temperature because it takes a lot of energy to change the temperature of water.
Thermal conductivity is another soil property that must be known in order to design a closed-loop or direct expansion GHP system. Direct expansion is a type of closed-loop system that doesn’t use a heat exchanger to transfer heat, but rather uses highly conductive pipe material, like copper, and directly transfers energy to the earth or soil. Thermal conductivity indicates the rate at which heat will be transferred between the ground loop and the surrounding soil for a given temperature gradient. The thermal conductivity of the soil is the critical value that determines the length of pipe required, which in turn affects the installation cost as well as the energy requirements for pumping working fluid through the ground loop.

Figure 4. Thermal Conductivity of Different Soil Types
Figure 4 indicates the thermal conductivity of different soil types. Heat transfer capability tends to increase as soil texture becomes increasingly fine, with loam mixtures having an intermediate value between sand and clay. As also shown in this figure, the thermal conductivity of any soil greatly improves if the soil is saturated with water. This effect is much greater for sandy soils than for clay or silt, since coarse soils are more porous and hold more water when wet. Therefore, groundwater level is another important site factor in evaluating a potential GHP project and optimizing the depth at which horizontal and spiral ground loops should be installed.
INSULATION
As previously stated, thermal mass is most appropriate in climates with a large diurnal (day-to-night) temperature range. For One Community’s specific location, high thermal mass construction with high insulation is desirable since the diurnal range/fluctuation is over 50º F (10° C). An ideal combination of thermal mass and insulation can be used to provide required thermal comfort very economically. When maximum heating efficiency is desired, it’s highly recommended to add EPS (Expanded Polystyrene) or a similar insulator under and around the sides of your greenhouse and climate battery system. This will effectively reduce heat loss to the surrounding soil and increase the climate battery’s heat capacity. Also consider the thermal mass of the greenhouse construction; a greenhouse with a concrete backing will store considerably more heat than a fully plastic construction. Adding thermal masses, such as black-painted barrels filled with water, can also be an effective thermal storage technique. However, making clear recommendations on thermal mass is difficult because solutions such as water barrels use space, money, and may not be needed depending on the construction of the greenhouse.

FAN SELECTION
A climate battery with the wrong fans installed will run inefficiently and will cause the fan to burn out more quickly, ultimately leading to worse heat transfer and higher costs. Choosing the right fans is therefore important and comes down to selecting a fan type, knowing your desired air flow, considering the static pressure of the system and, of course, matching the fan diameter to your tubing diameter (to ensure a proper fit upon installation).
FAN TYPE
There are two main types of fan to consider for a climate battery: axial fans and centrifugal fans (blowers). The main difference between the two is that axial fans are able to move a large volume of air, measured in cubic feet per minute (CFM), but maintain a low pressure. Centrifugal fans tend to have low CFM but produce a greater pressure differential.
For One Community’s application, the internal volume of the structure is very large and the air needs to be refreshed often, therefore requiring a high CFM. However, since the air needs to flow through a considerable length of pipes, there is a lot of pressure loss caused by friction. This means that for there to be air flow, the fan needs to produce a considerably large pressure differential. For climate batteries, it is recommended to use in-line axial fans.
TOTAL AIR FLOW
The ACH, or air changes per hour, is the number of times the air in a structure needs to be recirculated. The CFM determines how many cubic feet can be moved or exchanged each minute and this refers to the air in the structure.
ACH = CFM*60/Volume
Recommended ACH should be between 5-10. To Find the CFM, the equation above is rearranged into:
CFM =ACH*Volume/60
STATIC PRESSURE
Static Pressure is the resistance to airflow (friction) caused by the air moving through a pipe, duct, hose, filter, hood slots, air control dampers, or louvers. Static pressure is measured in inches of water gauge (SPWG), or in the metric equivalent it is rated in Pascal’s (Pa). This should include the pressure drop through all of the ductwork on the inlet and outlet of the fan or blower plus the pressure drop through any filters, control dampers, louvers, and other system components that restrict airflow.
When selecting a fan, it is important to understand its corresponding characteristic curve such as the one illustrated in Figure 1. By drawing a vertical line from the CFM at which your fan will be providing for your system, you will find the corresponding static pressure. Fans create “positive” static pressure while all other components in your system disturbing the air flow cause “negative” static pressure. The fan should be selected based on this curve and the pressure drop calculated from the tubing.

Figure 5. Characteristic Curve of A25c89t-3c / 500 CFM Ventilation Exhaust Fan Motor Industrial
As previously stated, pressure drop is affected by the friction within the pipe and therefore, “friction loss” and “pressure drop” can be understood as the same thing. The Friction Loss Chart in Figure 2 will provide the friction loss per 100 ft of a tubing given that at least two of the following properties are known: Air Velocity (FTM), Air Volume Flow (CFM), or Duct Diameter (in).

Figure 6. Friction Loss Chart – Click for source
To determine the friction loss per-unit length you must determine the initial velocity and size of the first section for this velocity. Table 6.1 can be used to determine a suggested initial velocity based on the CFM of the system.

Table 6.1. Suggested Initial Velocity in Round Systems
The following equation will approximate the pressure drop per 100ft of tubing.
The duct friction loss equation for calculating pressure drop per 100 ft of duct length (
ΔP100 ft
) involves multiplying a constant (2.56) by the duct diameter term (
1D
)1.18 and the airflow velocity term (
V1000
)1.8.

CONTROLS, SENSORS, AND AUTOMATION
Maintaining a controlled environment is important for plant health. A matter of hours in the wrong environment can cause plants to become significantly damaged or even dead. Having the proper sensors and controls can reduce labor, save energy, and increase plant health and yield. There are many existing available options from industrial systems to amateur DIY solutions.
The best system for your project will depend on your specific needs. We therefore recommend doing research on what will work best for you. Linked below are additional resources depending on what kind of setup you are looking for.
Here are the sensors and automation plans for our aquapini and walipini designs:
Coming…
DESIGNING FOR HEATING
The climate battery will provide both heat and ventilation, however in most climates this will not be enough and extra heating and ventilation will be required. This guide draws directly from heating and cooling handbooks that serve as HVAC industry standards, specifically ASHRAE and ANSI.
The major sources of heat loss occur from conduction, radiation, convection, and infiltration (outside air entering the greenhouse). Using simple equations from ASHRAE, the total heat loss can be found by summing two equations.

Heat loss by radiation, conduction, and convection (qc) and heat loss by infiltration (qi) can be determined by the following:
The convection heat loss (qc) can be found by multiplying the overall heat loss coefficient (U), the exposed surface area (A), and the temperature difference between the inside and outside (ti-to).
qc=UA(ti-to)
The infiltration heat loss (qi) can be found by multiplying 0.5 times the greenhouse internal volume (V), the number of air exchanges per hour (N), and the temperature difference between the inside and outside (ti-to).
qi=.0.5 * VN(ti-to)
Giving the total heat loss (qT). The total heat loss (qT) is the sum of convection heat loss (qc) and infiltration heat loss (qi).
qT=qc+qi
Where:
U = overall heat loss coefficient, W/(m2*K) (see Table 2,3)
A = exposed surface area, m2
ti = inside temperature, C
to = outdoor temperature, C
V = greenhouse internal volume, m3
N = number of air exchanges per hour (see Table 4)
Table 2 below represents four different materials – glass, plastic film, corrugated glass fiber, and plastic structure – and their classifications based on multiple glazing, films, panels, and thicknesses, along with their corresponding heat transmission coefficients (U).

Table 3 below represents construction U-Factor multipliers for metal frames and glazing systems for 400 mm to 600 mm, and 1200 mm spacing, as well as for fiberglass and film plastic on metal frames, and film or fiberglass on wood.

Table 4 below represents the suggested design air changes (N) for new construction using glass lapped, plastic film, structural sheets, and film plastic over glass, as well as for old construction with both good and poor maintenance.

Maximum design heating load should be based upon the inside temperature required by the plants at night and an expected coldest night temperature.
Once you’ve found the total heat loss for your greenhouse, it is recommended that you size a heater to fully compensate for that loss. The climate battery will cover much of your heating requirements but is not reliable enough in cold and cloudy conditions. Of course, you can also omit a heater and plant only crops that will survive cold snaps.
SOLAR RADIATION HEAT GAIN CONSIDERATIONS
The following is a set of equations meant to give a better understanding of the solar radiation heat gain and the effectiveness of the climate battery at cooling.
First, we will need to find the maximum solar heat gain (Q) and then design the system around that. Q can be determined from the following equation:
Q = Qsun × Aroof × cos(roof − summer) × ts
Units of measurement are:
Qsun = maximum solar radiation, can be found via a Report or Calculator, W/m2
Aroof = area of the greenhouse roof, m2
roof = the angle of your roof from parallel with the ground (degrees)
summer = the angle of the sun at the summer solstice = (90 − Latitude + 23.5), or use a Calculator
cos(roof − summer) = cosine of the difference between roof angle and sun angle
ts = transmissivity of your greenhouse glazing material (dimensionless, typically 0–1)
Once Q is found, the flow rate of air needed to cool the greenhouse can be determined by the following:
The volumetric flow rate (V) can be found by dividing the heat gain of the greenhouse (Q) by the product of the specific heat capacity of air (Cp), the temperature difference between the inside and outside air (Tin – Tout), and the density of air (ρ).
V = Q / (Cp × (ti − to) × ρ)
Units of measurement are :
V = volumetric flow rate, m3/s
Cp = 1 = specific heat of air ≈ 1 kJ/kg·K
ti = inlet air temperature, °C (maximum allowable greenhouse temperature)
to = outlet air temperature, °C (temperature of the earth, ~12–13°C / ~55°F)
ρ = density of air ≈ 1.2 kg/m3
Q = solar heat gain, kW
The units – kJ = kilojoules (unit of energy), kg = kilogram (unit of mass), K = Kelvin (unit of temperature difference), m³ = cubic meters (unit of volume), s = seconds (unit of time), 1 kW = 1,000 watts = 1,000 joules per second.
AREA AND HEAT GAIN CALCULATION
The below image illustrates different areas of the greenhouse, labeled A1 (Top part Of GreenHouse), A2, A3, A4 (Right side of GreenHouse), A5 (Left Side of GreenHouse), and A6 (Back side of GreenHouse where pipe attached), as well as the dimensions of the various sides of the greenhouse.

Greenhouse with different Areas and Dimensions
The basic assumption now is that the sun’s rays are directly hitting areas A1, A2, A3, A4, and A5. The other area (A6) is not exposed to sunlight and is not affected by it.
Based on the image, the first step is to identify the rooftop areas that are exposed to sunlight — namely A1, A2, A3, A4, and A5. We assume that sunlight is directly striking the top roof area (A1) at a 90-degree angle. The adjacent sloped sides (A2 and A3) are assumed to receive sunlight at an angle. For simplicity, we further assume that A4 and A5 are exposed to direct sunlight individually — meaning when the sun rays hit A4, A5 is shaded, and vice versa. Therefore, in the heat gain calculation, only one of these areas (either A4 or A5) needs to be considered, as both have approximately the same surface area. Another assumption is that the remaining back side of the greenhouse is not exposed to sunlight (A6).
The above assumption is important because we will calculate heat only during the time when the sun’s rays directly strike the rooftop at a 90-degree angle. Additionally, we will consider how much heat affects the other two faces during that time, and the angle of these two sides will be calculated based on this scenario.
Area conversion can be calculated using the relation 1 inch = 0.0254 meters, which means 1 square inch (1 in2) equals (0.0254 m × 0.0254 m) = 0.00064516 m2. Therefore, 1 in2 = 0.00064516 m2, so 100 in2 is approximately 0.0645 m2, and 1,000 in2 is approximately 0.645 m2.
FINDING THE AREA OF SURFACE A1
The following image shows the area of surface A1. This area is 446,659.67 in2 = 288.167 m2.

Area of the rooftop where sun rays hit directly at a 90-degree angle.
FINDING THE AREA OF SURFACE A2
The following image shows the area of surface A2. This area is 97,845.82 in2 = 63.13 m2.

Area of the rooftop where sun rays hit directly at a 90-degree angle
FINDING THE AREA OF SURFACE A3
The following image shows the area of surface A3. This area is 66,744 in2 = 43.10 m2.

Area of surface A3 – Click for source
FINDING THE AREA OF SURFACE A4
The following image shows the area of surface A4. This area is 53,703.81 in2 = 34.65 m2.

Total Area of Left Side of Greenhouse – Click for source
To calculate the total heat gain from solar radiation, the surfaces exposed to the sun need to be considered. The heat gain for each surface should be calculated separately and then summed to obtain the total heat gain.
For this case study, the selected site is Salt Lake City, Utah. The angle of the sun at the summer solstice, referred to as the summer angle, can be calculated using the formula – summer = (90° – Latitude° + 23.5°) or use a Calculator. Substituting the latitude of Salt Lake City (40.1°), the summer angle is: 90° – 40.1° + 23.5° = 73.4°.
The image below represents the latitude angle based on the location, which is used to calculate the summer angle.

Latitude angle based on location
The image below shows the realistic average daily insolation by month (kWh/m2/day), and these values will be helpful in the equation to calculate the total heat gain by radiation.

Realistic average daily solar insolation
To calculate how much power can be generated per day, multiply any of the above monthly values by the area where the sun rays directly hit. For better understanding, the value for July—the highest—will be used in the calculation means 5.564 kWh/m2/day.
For greenhouse glazing made of HDPE (high-density polyethylene), the transmissivity (ts) depends on factors like thickness, clarity, and whether it is single- or multi-layer. Typically, clear HDPE film has a transmissivity range of about 0.75 to 0.85 for solar radiation (visible + near-IR spectrum), and a commonly used representative value is ts = 0.80.
The heat equation represents the heat gain by the greenhouse (Q). It includes the multiplication of maximum solar radiation (Qsun), area of the greenhouse roof (Aroof), the cosine of the difference between the roof angle and the summer sun angle [cos(roof angle – summer angle)], and the transmissivity of your greenhouse glazing material (ts).
Q = Qsun * Aroof * cos(roof – summer) * ts
roof = the angle of your roof from parallel with the ground
summer angle = the angle of the sun at the summer solstice = (90° – Latitude° + 23.5°), or use a Calculator
cos(roof – summer) = cosine (roof angle° – summer angle°)
For calculating total heat gain, the roof angle is very important, and different areas have their own specific roof angles, such as:
A1 = 5°, A2 = 62.94°, A3 = 90°, A4 = 90°
HEAT GAIN BY AREA A1
roof = the angle of your roof from parallel with the ground = 5°
Q1 = Qsun * Aroof(1) * cos(roof – summer) * ts
Q1 = 5.564 * 288.167 * cos(5 – 73.4) * 0.80
Q1 = 477.09 kWh/day
HEAT GAIN BY AREA A2
roof = the angle of your roof from parallel with the ground = 62.94°
Q2 = Qsun * Aroof(2) * cos(roof – summer) * ts
Q2 = 5.564 * 63.13 * cos(62.94 – 73.4) * 0.80
Q2 = 276.62 kWh/day
HEAT GAIN BY AREA A3
roof = the angle of your roof from parallel with the ground = 90°
Q3 = Qsun * Aroof(3) * cos(roof – summer) * ts
Q3 = 5.564 * 43.10 * cos(90 – 73.4) * 0.80
Q3 = 183.67 kWh/day
HEAT GAIN BY AREA A4
roof = the angle of your roof from parallel with the ground = 90°
Q4 = Qsun * Aroof(4) * cos(roof – summer) * ts
Q4 = 5.564 * 34.65 * cos(90 – 73.4)
Q4 = 184.42 kWh/day
TOTAL HEAT GAIN Q TOTAL BY AREA A1, A2, A3, AND A4
Qtotal = Q1 + Q2 + Q3 + Q4 = 477.09 + 276.62 + 183.67 + 184.42
Qtotal = 1,121.80 kWh/day
Note – Total Heat Gain (Q) value depends on realistic average daily solar insolation and changes based on the month; therefore, the total heat gain value will vary accordingly.
Average continuous power – Pavg = Qtotal24 = 46.55 kW
COMPARISON OF TOTAL HEAT GAIN (Q) WITH A 2-
For better understanding, the value of 1,121.80 kWh/day can be compared to the energy consumption of a 2-ton air conditioner, which typically uses about 2.5 kW when operating. If it runs continuously for 24 hours, its total consumption would be 2.5 kW × 24 h = 60 kWh/day. Comparing this to 1,121.80 kWh/day, we get 1,121.80 ÷ 60 ≈ 18.7, meaning that 1,121.80 kWh/day is approximately equal to the daily energy usage of about 19 two-ton AC units running non-stop.
Running 24 hours/day, a 2.5 kW unit uses 2.5 kW × 24 h = 60 kWh/day. Comparing this to 1,121.80 kWh/day: 1,121.80 ÷ 60 ≈ 18.7.
This means 1,121.80 kWh/day is roughly equal to the daily energy use of about 19 two-ton AC units running continuously.
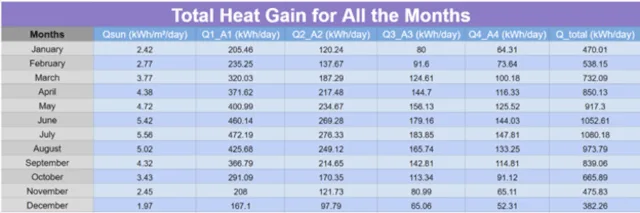
TOTAL HEAT GAIN FOR ALL THE MONTHS
The image below represents the heat gain from each side of the greenhouse calculated separately and then summed to determine the total heat gain for all months.
Click For Spreadsheet
DESIGNING FOR VENTILATION
The climate battery will provide a significant amount of cooling but the system does have its limitations. Specifically, during an extended period of hot days, the soil surrounding the system can reach nearly the same temperature as the inlet air, making any heat transfer ineffective. We therefore recommend building in adequate ventilation. An air exchange rate (the number of times the total air volume in a space is completely removed and replaced in a given time span) of 0.75 to 1 change per minute has been proven to effectively control the temperature rise in a greenhouse (Figure 7). We recommend achieving this through a combination of natural and mechanical ventilation and thinking of the climate battery as an added efficiency.

Figure 7. Influence of Air Exchange Rate on Temperature Rise in Single- and Double-Covered Greenhouses
Additional passive cooling included in the aquapini and walipini designs is underground piping that runs from the central pond into the structures. On hot days when venting causes negative pressure within the structures, this piping draws cool air from the pond surface and further cools that air through its passage underground.
Winter ventilation should be designed to prevent cold drafts on plants. This has been a problem with some systems using shutters at one end of a house and an exhaust fan at the other. The problem can be minimized by placing the intake high in the gable and using baffles to deflect the incoming air.
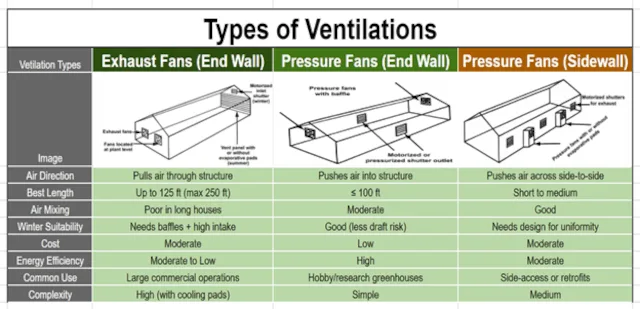
TYPES OF VENTILATIONS
There are three primary types of ventilation systems used in greenhouses – exhaust fans (end wall), pressure fans (end wall), and pressure fans (side wall). The chart below represents the differences between these three ventilation systems based on various parameters.
Click for source spreadsheet
EXHAUST FANS (END WALL)
The below image represents exhaust fans located in the end wall, which pull air through the greenhouse structure. Air enters through motorized inlet shutters during winter or vent panels with or without evaporative pads during summer, and is drawn out by exhaust fans mounted at plant level. This method is best suited for houses up to 125 feet in length (though it can work up to 250 feet). It provides moderate energy efficiency, but performance declines in very long houses due to uneven air mixing. It is most common in large commercial operations and works well when combined with cooling pads, though installation can be relatively complex.

Fans in end wall
PRESSURE FANS (END WALL)
The below image represents pressure fans with baffles installed in the end wall, which push air into the structure through motorized or pressurized shutter outlets. This system is generally suited for houses 100 feet or shorter and provides moderate air mixing while avoiding drafts in winter. It is low cost and simple to install, making it popular in hobby or research greenhouses. However, it has low energy efficiency compared to exhaust systems.

Pressure fans mounted high in end walls
PRESSURE FANS (SIDE WALL)
The below image represents pressure fans installed in the sidewalls, which push air across the greenhouse side-to-side, exiting through motorized shutters on the opposite side. This system is well suited for short to medium-length houses, where uniformity of air distribution is critical. It provides good air mixing but requires careful design to ensure uniform air movement. Costs and complexity are moderate, making it common for side-access houses or retrofit projects.

Pressure fans mounted high in sidewalls
VENTILATION RATE EQUATIONS
Ventilation in greenhouses is essential for temperature regulation, humidity control, and CO₂ exchange. There are two primary types of ventilation – natural and mechanical.
NATURAL VENTILATION
Used when airflow is driven by wind or thermal buoyancy forces through roof and side vents. Natural ventilation is categorized into two types – wind-driven ventilation and buoyancy (stack effect) ventilation.
WIND-DRIVEN VENTILATION
The wind-driven ventilation equation for calculating ventilation (Q) rate involves multiplying the wind pressure coefficient (Cw), total open vent area (A), and wind speed (V).
Q = Cw * A * V
Units of measurement are :
- Q = ventilation rate (m3/s)
- Cw = wind pressure coefficient (typically 0.3 – 0.6)
- A = total open vent area (m2)
- V = wind speed (m/s)
BUOYANCY (STACK EFFECT) VENTILATION
The buoyancy ventilation equation for calculating ventilation rate (Q) involves multiplying the stack coefficient (Cs), vent area (A), gravitational acceleration (g), height difference between inlet and outlet vents (H), the temperature difference between inside and outside (ΔT), and average air temperature (Tavg).
Q = Cs * A * √ 2 * g * H * ΔTTavg
Units of measurement are :
- Q = ventilation rate (m3/s)
- Cs = stack coefficient (typically ~0.65)
- A = vent area (m2)
- g = gravity (9.81 m/s2)
- H = height difference between inlet and outlet vents (m)
- ΔT = Tinside − Toutside (K or °C)
- Tavg = average air temperature (K)
MECHANICAL VENTILATION EQUATION
Used when fans are installed to actively move air. The mechanical ventilation equation for calculating the ventilation rate (Q) involves the relationship between the total volume of the greenhouse (V) and the time required to fully exchange the air (t).
Q = Vt
Units of measurement are :
- Q = ventilation rate (m3/s or CFM)
- V = total volume of the greenhouse (m3 or ft3)
- t = time to fully exchange the air (s or min)
FAN CAPACITY SIZING (US UNITS)
The fan capacity sizing equation to find Cubic Feet per Minute (CFM) involves multiplying the volume of the greenhouse by the number of air changes per hour.
CFM = Volume × Air Changes per Hour60
Units of measurement are :
- CFM = Cubic Feet per Minute of required fan capacity
- Typical air changes – 20 – 60 ACH (Air Changes per Hour) depending on climate and crop
EQUATION OF HEAT LOSS OR GAIN DUE TO VENTILATION
In this section, the heat calculations are performed based on ventilation.
In the ventilation heat change equation, the heat loss or gain (Q) is calculated by multiplying the volumetric airflow rate (V), air density (ρ), specific heat capacity of air (Cp), and the temperature difference between the inside and outside air (Tin – Tout).
Q = V * ρ * Cp * (Tin – Tout)
Units of measurement are ;
- Q = Heat loss or gain due to ventilation (Watts or J/s or joules per second)
- V = Volumetric airflow rate (m3/s or cubic meters per second)
- ρ = Density of air (~1.2 kg/m3 at room temperature)
- Cp = Specific heat capacity of air (~1005 J/kg·K)
- Tin = Indoor air temperature (°C or K)
- Tout = Outdoor air temperature (°C or K)
Alternate Form (using CFM in imperial units) :
In the alternate form of the heat change equation, the heat loss or gain (Q) is calculated by multiplying the CFM by the temperature difference between the inside and outside air.
Q (BTU/hr) = 1.08 * CFM * (Tin − Tout)
Where :
- CFM = Cubic feet per minute
- 1.08 = Constant derived from air density and specific heat in imperial units
Interpretation :
- Positive Q → Heat loss (cold outside air enters)
- Negative Q → Heat gain (hot outside air enters)
For One Community’s Walipini #3, calculations show a heat loss of approximately -250,000 BTU/hr in peak winter conditions. This includes 230,000 BTU/hr from conductive losses and 20,000 BTU/hr from infiltration losses.
The recommended method for finding the cooling load is the CLTD/SCL/CLF method; a one-step, hand calculation procedure.
It may be used to approximate the cooling load corresponding to the first three modes of heat gain (conductive heat gain through surfaces such as windows, walls, and roofs; solar heat gain through fenestrations; and internal heat gain from lights, people, and equipment) and the cooling load from infiltration and ventilation. The acronyms are defined as follows:
CLTD — Cooling Load Temperature Difference
SCL — Solar Cooling Load
CLF — Cooling Load Factor
Go to page 28.39 of this handbook to find details of this calculation procedure.
VENTILATION CALCULATION FOR THREE POINTS
It comes from the first law of thermodynamics (energy conservation) applied to steady airflow. In the ventilation heat change equation, the heat loss or gain (Q or Pavg) is calculated by multiplying the volumetric airflow rate (V), air density (ρ), specific heat capacity of air (Cp), and the temperature difference between the inside and outside air (Tin – Tout).
Pavg = Vrate × ρ × Cp × (Tin − Tout) ⇒ Vrate =
Pavgρ × Cp × |ΔT|
, ΔT = Tin − Tout
Units of measurement are:
- Q = Pavg = Heat loss or gain due to ventilation (Watts or J/s)
- Vrate = Volumetric airflow rate (m3/s)
- ρ = Density of air (~1.2 kg/m3 at room temp)
- Cp = Specific heat capacity of air (~1005 J/kg·K)
- Tin = Indoor air temperature (°C or K)
- Tout = Outdoor air temperature (°C or K)
From the depth plot, the midsummer ground temperature at approximately 2.5 ft below the surface is around 22 °C, which falls within the 20–24 °C range observed in the summer cases; therefore, for this analysis, the underground temperature is taken as 22 °C as a representative monthly mean value.
Air properties (standard) – ρ ≈ 1.2
kgm3
and Cp ≈ 1005
Jkg × K
For more accurate calculations and explanations, multiplying the air properties such as ρ and Cp is very helpful.
ρ × Cp ≈ 1206
Jm3 × K
Based on the greenhouse geometry and applying a 0.8 shape factor to account for sloped surfaces, the total internal volume is calculated as:
V ≈ 32.64 × 10.06 × 3.6 × 0.8 ≈ 950 m3
General formula – Vrate =
Pavgρ * Cp * |ΔT|
, ΔT = Tin − Tout
Then – CFM = Vrate * 2118.88 and ACH =
Vrate * 3600V
and
VolumeMinute =
ACH60
FIRST CASE – HOLD 30 °C
ΔT = Tin − Tout = 30 − 22 = 8 °C
Vrate =
Pavgρ * Cp * |ΔT| =
46,5501206 * 8
= 4.825 m3/s
CFM = 10,223
ft3min
and ACH =
Vrate * 3600 V= 18.28
1hr
and
VolumeMinute =
ACH60
= 0.305
~0.30
VolumeMinute
on average July load. If you want the rule-of-thumb 0.75 – 1.0
VolumeMinute, you’d size closer to –
Vrate = 0.75 *
V60
= 11.88 m3/s (≈ 25,200 CFM)
And for midday peaks use *~2
SECOND CASE – HOLD 24 °C
ΔT = Tin − Tout = 24 − 22 = 2 °C
Vrate =
Pavgρ × Cp × |ΔT|
=
46,550
1206 × 2 = 19.298
m3s
CFM = 40,891 = 19.298
ft3min and ACH =
Vrate × 3600V
= 73.13
1hr
and
VolumeMinute
=
ACH60
= 1.219
To stay at 24 °C with ground ~22 °C in July, you need ~1.22
volumes/min on average (i.e., above the 0.75–1.0 guideline). Add a peak factor (~×2) for fan selection: ~82,000 CFM installed capacity.
And for midday peaks use ×2
THIRD CASE – HOLD 0 °C
ΔT = Tin − Tout = 0 − 22 = −22 K
Vrate =
Pavgρ × Cp × |ΔT|
=
46,5501206 × 22
= 1.754
m3s
CFM = 3,717 = 19.298
ft3min and ACH =
Vrate × 3600V
= 6.65
1hr
and
VolumeMinute
=
ACH60
= 0.111
The sign of ΔT is negative → with ground warmer than the setpoint, this airflow number represents the heating/cooling offset magnitude, not a cooling requirement. Holding a greenhouse at 0 °C in July is a heating problem (and unusual for crops).
And for midday peaks use ×2
COOLING AIRFLOW REQUIRED TO HOLD 30 °C / 86 °F
The image below represents the calculation of total heat, average power, volumetric flow, CFM, ACH, and peak CFM required to maintain 30 °C / 86 °F.
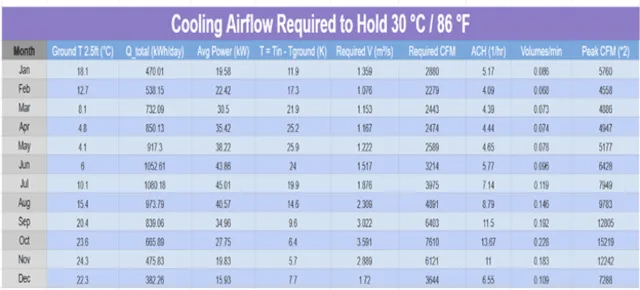
Click for Spreadsheet
COOLING AIRFLOW REQUIRED TO HOLD 24 °C / 75.2 °F
The image below represents the calculation of total heat, average power, volumetric flow, CFM, ACH, and peak CFM required to maintain 24 °C / 75.2 °F.
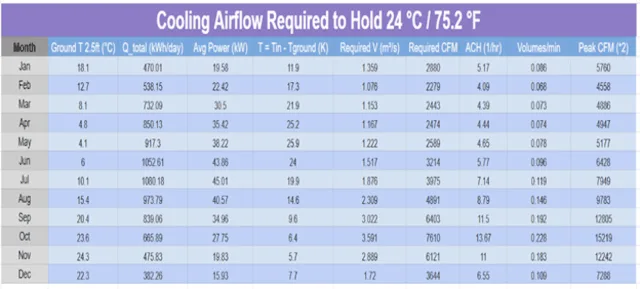
Click for Spreadsheet
COOLING AIRFLOW REQUIRED TO HOLD 0 °C / 32 °F
The image below represents the calculation of total heat, average power, volumetric flow, CFM, ACH, and peak CFM required to maintain 0 °C / 32 °F.
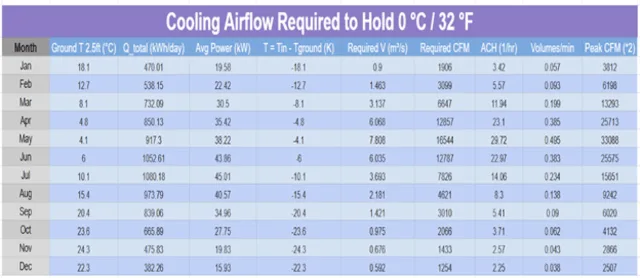
Click for Spreadsheet
HEATING & COOLING EQUIPMENT REQUIREMENT
The analysis classifies each month based on what is required to maintain the greenhouse setpoint using the climate battery system (ground air at approximately 2.5 ft depth, which varies seasonally) together with fan ventilation.
- If the average airflow required to offset solar heat at the month’s ground temperature is ≤ ~1.0 volumes per minute (vol/min), then strong fan ventilation alone is sufficient. The design target should be 0.75 – 1.0 vol/min, with additional capacity for peak conditions (≈ ×2 headroom).
- If the airflow requirement is > ~1.0 vol/min average (and especially > ~2.0 vol/min at peak), then active cooling such as evaporative pads or an air-conditioning/heat pump system in cooling mode is recommended in addition to fans.
- When maintaining an indoor setpoint well above the ground temperature during cold months, nighttime conduction and infiltration losses exceed the climate battery’s capability. Under such conditions, supplemental heating becomes necessary to sustain the target temperature.
Given that the greenhouse volume is approximately 950 m3, maintaining an air exchange rate of 0.75 – 1.0 vol/min corresponds to an installed fan capacity of approximately 11.9 – 15.9 m3/s, or 25,200 – 33,700 CFM. For optimal performance under peak solar load, this capacity should be doubled to provide sufficient operational margin.
HEATING AND COOLING REQUIREMENT CONCEPT
This section explains when external heating and cooling are required, how they can be avoided under certain conditions, and what precautions should be taken based on the heat-in and heat-out balance. It also describes three temperature scenarios and the corresponding rules of thumb.
THE BASIC ENERGY BALANCE
The inside temperature of a greenhouse is determined by the balance of heat in and heat out. When these two are equal, there is no change in stored heat, allowing the greenhouse to maintain a steady internal temperature.
Sources of Heat In – refer to the various factors or mechanisms that introduce heat into the greenhouse.
- Solar radiation
- Internal heat (fans, lights, people, equipment)
- Climate battery return air (warm ground air in winter)
- Heaters (external energy)
Sources of Heat Out refer to the various factors or mechanisms through which heat leaves the greenhouse
- Conduction, convection, and radiation through walls, roof, and glazing
- Infiltration (cold air leakage)
- Ventilation (intentional air exchange)
- Climate battery intake (if ground air is cooler than inside)
- Cooling equipment (fans, evaporative pads, or AC)
COMPARE THREE KEY TEMPERATURES
Symbol Description:
- Tin – Target greenhouse interior temperature
- Tout – Outside air temperature
- Tground – Underground air temperature (climate battery air)
For each month (or hour in detailed models), compare the energy balance to determine when heating or cooling is required, and identify when external systems are needed by evaluating the direction and magnitude of heat flow between the desired temperatures.
CASE 1 – HEATING REQUIRED
If Tin > Tground and Tin > Tout
then both the ground and outside air are colder than your target.
- The climate battery can help, but only up to Tground.
- Any remaining difference must come from external heating.
Example – In January at Salt Lake City – Tin = 24 °C, Tout = -3 °C, and Tground = 8 °C
→ Ground air adds some warmth (to 8°C), but you still need to raise air 16°C to reach 24°C → heating required.
CASE 2 – COOLING REQUIRED
If Tin < Tground and/or Tin < Tout
then both the ground and outside air are warmer than your target.
- Fans can’t make the air colder than the ground.
- External cooling (evaporative pads or AC) is required.
Example – In July – Tin = 24 °C, Tout = 33 °C, and Tground = 26 °C
→ Ground is slightly cooler, but not enough to offset full solar gain → fans + evaporative cooling needed.
CASE 3 – PASSIVE BALANCE (NO EXTERNAL SYSTEM NEEDED)
If Tground < Tin < Tout
then the climate battery can passively cool by pulling in cooler underground air and releasing it inside.
Fans alone are usually enough here.
Example – In May – Tin = 30 °C, Tout = 38 °C, and Tground = 28 °C
→ Ground is cooler than inside, so the climate battery can cool naturally → no AC or heater needed.
USE TEMPERATURE DIFFERENCE MAPS TO MARK SEASONS
You can mark each month as Heating / Cooling / Balanced simply by comparing average temperatures –
The image below represents the average outside and ground temperatures, and indicates the type of external HVAC requirement needed to maintain 30°C and 24°C inside the greenhouse.

External HVAC Requirement – Click for Spreedsheet
QUICK RULES OF THUMB
The image below represents four different types of conditions, what to expect in each, and what should be installed in the greenhouse to maintain the desired inside temperature.

Quick Rules of Thumb – Click for Spreedsheet
The table explains four different temperature scenarios and what to expect throughout the year from the greenhouse and ground temperatures. It also describes the possible actions required to maintain the greenhouse’s internal temperature, such as using fans, external heating, or cooling systems.
VALIDATION
In order to quantify the effectiveness of One Community’s climate battery design, a team of engineers have worked on validating the design through various modeling approaches. The models will give a useful approximation of the system and its effectiveness.
- 2d Modeling of the Climate Battery
- Evaluation of Boundary Conditions
- Simulation
- 3d Modeling of the Climate Battery
2D MODELING OF THE CLIMATE BATTERY
This is the first 2D model (more research/modeling is needed/coming) to study the airflow inside the climate battery. For the first model many assumptions are made for simplicity and initial evaluation. More accurate assumptions will be considered later.

- Soil and inside air are separated and cannot exchange heat at the boundaries. The heat is just exchanged through the climate battery pipes. This assumption is to study the role of the pipes only.
- Top surface of the green house has been assumed to be 100°F.
- Top surface of the soil is assumed to be constant 80°F.
- Bottom surface of the soil domain is assumed to be 70°F.
- The thermal resistance between the pipe and the soil is considered to be zero. (First we want to see an ideal case of zero resistance and see the “transfer” of heat from air to the soil. Then we’ll consider the effect of pipe walls’ thermal resistance.)
- The bottom, left, and right walls of the greenhouse are insulated. (More accurate thermal conditions will be added later. Now we want to evaluate the flow of the air.)
- One pipe is considered for heat transfer from the air to soil.
- The greenhouse has a volume of 3178 ft3 (90 m3).
- These are the functions of the fan:
- The fan changes all air inside the greenhouse 20 times every hour.
- Volume change rate: Vdot = 1060 CFM (0.5 m3/s)
- Velocity inside the pipes: 6.5 ft/s (2 m/s)
- Conditions are steady.

This is the air velocity inside the greenhouse:


Air flow vectors inside the pipe:

Air flow vectors inside the greenhouse:

The air flows from the inlet at the top right side of the greenhouse to the outlet at the bottom left side. Air velocity inside the pipes are an order of magnitude bigger than the air velocity inside the greenhouse.
Temperature variations inside the climate battery:


Temperature of the air:


Temperature of the soil:


SUMMARY OF 2D FINDINGS
As can be seen, the way air enters the climate battery pipe transfers the heat to the soil. The cold air enters the greenhouse from the top right side. The top left side is the hottest location and the top right side is the coldest location of the greenhouse. The air enters the pipe with an average temperature of 35°C (96°F) and exits with an average temperature of 34°C (93°F). The average temperature of the greenhouse is 35°C (95°F). These results are limited for a few reasons. First, they are running assuming steady state conditions, in which the heat transfer rates remain constant, and therefore omit the dynamic state in which the climate system will actually run. Second, the boundary conditions are initial assumptions and are simplified. The next section will evaluate the boundary conditions in an attempt to refine these results.
EVALUATION OF BOUNDARY CONDITIONS
Before extending the simulation of the airflow, we need to evaluate the boundary conditions to obtain more accurate values that are closer to actual applications. For this purpose, we assume the following simple geometry for the greenhouse and the soil beneath it:

This is to capture more depth of the soil where we can assume that the temperature remains constant throughout the year with negligible error. Here we assume that at a burial depth of 50 ft the soil temperature is constant. We assume the following conditions:

- A natural convection is assumed at the outside of the greenhouse walls.
- The outside air temperature is obtained from the local seasonal temperature changes and climate conditions.
- The surface soil temperature is assumed to be the same as the outside air temperature.
- The floor of the greenhouse is assumed to be concrete.
- The thermal resistance due to the glass on the ceiling and walls at the left and right side of the greenhouse are neglected.
To obtain the values and show the design process, the conditions of the climate battery for the aquapinis is based on average variations of Los Angeles during January. The climate variations are obtained from Weather Spark (the conditions for any day/month/year and location can be obtained here). Based on the following figure, we can assume an average outside air temperature of 68°F during the days and 48°F during the nights in January.
SIMULATION
These simulations were created using weather parameters based on the Los Angeles area. If you’re considering running your own simulations, personalize the parameters to your location and greenhouse. Considering average conditions for 12 hours a day, in January, and simulating the transient thermal conditions, the temperature profile will be:

As can be seen, since the average outside temperature is close to the assumed temperature value in the deep soil, the temperature is almost uniform inside the soil with the soil at the bottom of the greenhouse being around 67°F. The temperature inside the greenhouse increases from an initial value of 68°F (assumed) to a value of 105°F after 12 hours of solar radiation on the ceiling during the day if the air stays still. Ventilation and the climate battery must be used to take this heat load off the greenhouse and keep its temperature constant. The boundary conditions from this simulation can be used in the previous 2D modeling for more accurate results.
Now, we want to see the effect of outside temperature and solar heat variations during a day in January. Since this is a transient simulation, the effects of transient boundary conditions are considered. For this purpose, the following problem is assumed:

In this model, only 30 ft of soil is considered. A concrete floor is considered at the bottom, the side walls are made of brick, and the ceiling is made of glass. First, a steady state thermal condition is assumed to achieve an initial temperature for the transient model (this helps to obtain more accurate results with fewer cycles). For the steady state, an average air temperature is considered, and a constant temperature is assigned at the 30 ft depth of the soil. The following is the result:

This shows that on an average sunny day in January the greenhouse will maintain its temperature to a 66°F (19°C) minimum which is above the 60°F (15.5°C) required by the plants.
3D MODELING OF THE CLIMATE BATTERY
A 3D model of a section of the climate battery system was created and put through winter and summer simulations (seen below). These CFD (computational fluid dynamics) simulations do not give an accurate representation of how the system will perform over an extended period of time, as it does not account for temperature variation within the day, heat storage within the soil, and other effects like wind and thermal contact resistance.
The simulations do show that the system will cool the greenhouse well in the summer. Inlet air at 100°F will be cooled to 60°F and pumped back into the greenhouse, providing a reliable source of cooling.

The winter simulations show that the climate battery will have limited effectiveness in the winter because of the cool soil temperature. Inlet air at 60°F will return at 45°F. It should be noted though that this does not take into account the heat storage that will occur on sunny days even in the winter. Additional research is needed to properly model the effectiveness of a climate battery in the winter. Modeling this system is difficult because of its dynamic nature.
One example of this is clear when considering the temperature of the soil surrounding the climate battery tubing, which directly impacts the rate of heat transfer between the soil and the air in the tubing. The soil temperature is dependent on the temperature of the surrounding soil and the temperature of the air running through the tubing. However, the air in the tubing is also dependent on the temperature of the soil and many other factors like the time of day. This kind of interdependent and time-dependent problem is difficult to solve with traditional thermodynamic models.
Temperature plays a crucial role in heat transfer. Different environmental conditions and greenhouse components determine the final temperature difference compared to the desired temperature inside the greenhouse.
In the upcoming section, the thermal simulation is explained in detail using SolidWorks software. It includes assumptions, boundary conditions, and results for eight different cases: the warmest and coldest days of summer and winter, as well as the warmest and coldest nights of summer and winter.
SIMULATION PARAMETERS/ASSUMPTIONS
Tubing Material: HDPE (high-density polyethylene)
Inlet Velocity = 250 CFM
Outlet Pressure = 81.2 KPa @6000 ft
Soil Properties = Dry Sand – Ran against “Dry Sand” and “Stiff gray brown sandy gravelly CLAY” with similar results
COLD CONDITION AT WEST JORDAN, UT
Temperature = 22°F
Humidity = 50%
Soil Temperature Gradient – Cold (Mid January)
HOT CONDITION AT WEST JORDAN, UT
Temperature = 92°F
Humidity = 95% at hottest
Soil Temperature Gradient – Hot (Mid August)
DIMENSIONS OF PIPES AND ASSEMBLY
This section provides a detailed overview of the pipe layout, showing how each pipe is interconnected and linked to the greenhouse, along with their respective dimensions.
In the image below, the topmost pipe (Pipe 1) is connected directly to the greenhouse and draws warm air from it, then delivers it to Pipes 2 and 3. Pipe 3 is further connected to a group of seven underground pipes (Pipes 4), which are all linked to a single main underground pipe (Pipe 5). This main pipe (Pipe 5) transfers the temperature-regulated air back into the greenhouse.

Single Pipe Assembly
This is the assembly video of the pipe setup. It provides a visual demonstration of how the pipes are connected, including key steps such as dismantling and reassembly. The video is intended to improve understanding of the single pipe assembly process.
Here’s an image showing the depth of the pipes and how they are connected to the greenhouse to draw the warm air from the top and pull it 2.5 feet below the ground. Two additional pipe assemblies are placed 1 foot and 2 feet below the first layer, respectively. In other words, the deepest pipe is located 4.5 feet underground. Based on the image below, we can understand how the pipes are connected to the greenhouse.

Climate Battery, Depth of Pipes, and How the Pipes are Connected to the Greenhouse
STRESS – STRAIN CALCULATION
The stress-strain simulation shows how much the pipe bends or shifts under the weight of 2.5 feet of soil. It’s important to check if the pipe can handle this pressure before starting the battery model. Doing this early helps prevent design problems and confirms that the layout is practical.
ASSUMPTIONS
Assumptions play a crucial role in defining how the simulation is set up. They determine which parts remain fixed, which parameters influence the results, which ones are held constant, and which parameters are excluded from the simulation. Here are the assumptions used for our Stress-Strain Simulation:
- SolidWorks software was used for stress-strain simulation because it can easily replicate real-world scenarios. At a basic level, SolidWorks provides an easy-to-understand explanation of material behavior under different conditions.
- The main focus of this simulation is to determine how much the pipes move and whether any deformation occurs.
- Pressure is applied only to the sections of the pipe that are underground, not to the portions above ground. This is because buried pipes experience pressure from the surrounding soil, while exposed pipes are open to the air and do not face external pressure.
- The ends of the pipes were fixed to observe how much the buried sections (under 2.5 feet) move when equal pressure is applied from all sides.
- The ground soil will not affect the pipes, meaning there will be no damage during installation. The land is assumed to be in ideal condition, without any stones or sharp objects that could cause harm to the pipes.
- Only soil pressure is acting on the pipes; no additional loads from objects or transportation are present above the ground.
CALCULATION
The pressure acting on the pipe is calculated from the image below. In geotechnical and structural engineering, understanding the total pressure exerted by soil—especially in buried structures such as tanks, foundations, or underground pipelines—is essential for safe design. This formula accurately accounts for both dry and saturated soil conditions.
This formula calculates the pressure exerted by soil on a pipe located below the ground surface, accounting for both the soil above the groundwater level and the soil below the groundwater level, which is partially buoyant due to the presence of water.
The pressure calculation formula includes the multiplication of soil density (ρs), gravitational acceleration (g), the difference between the depth from the surface to the object and the depth from the groundwater level to the object (h − hw), the density of the soil below the groundwater level (ρsw), and the depth from the groundwater level to the object (hw). The formula is shown in the image below.

This formula is used to calculate the pressure applied to the pipes
Assuming the water level as zero, with a soil density of 1850 kilograms per cubic meter (kg/m³), gravitational acceleration (g) of 9.81 meters per second squared (m/s²), and depth of 2.5 feet (0.762 meters), the pressure exerted by the soil (Psoil) is calculated as 13,830 pascals, which is equivalent to approximately 2.005 psi.
- Let’s take the water level = 0
- Density = 1850 kg/m³
- g = 9.81 m/s²
- h = 2.5 ft = 0.762 m
- Pressure of soil = 1850 × 9.81 × 0.762 = 13,830 Pa
- Convert Pa into psi = 2.005 psi
13,830 pascals is approximately 2.005 psi.
This explanation describes how to convert pressure values from Pascals (Pa) to pounds per square inch (psi) and shows how different pressure units relate to each other. PSI, or pounds per square inch, measures how much force is applied to a specific area. For example, when you push your hand on a balloon, the harder you push, the more pressure you create. In this case, psi represents how many pounds of force are pressing on each square inch of surface — for instance, 30 psi means 30 pounds of force are applied to every square inch.
This formula is used to convert pressure between different units. It compares four common units: Pascal (Pa), Newton per square millimeter (N/mm²), kilopascal (kPa), and pounds per square inch (psi or lbf/in²). For example, 1 Pascal is equivalent to 0.000001 N/mm², 0.001 kPa, or 0.000145 psi (lbf/in²). This makes it easy to switch pressure values into the unit you need.
1 Pa = 10⁻⁶ N/mm² = 10⁻³ kPa = 1.450 × 10⁻⁴ psi (lbf/in²)
PSI (pounds per square inch) and lbf/in² (pound-force per square inch) actually mean the same thing. PSI is just the common shorthand for this.
lbf = pound-force (a unit of force).
in² = square inch (a unit of area).
So, lbf/in² = the amount of force (in pounds) applied on an area of one square inch.
RESULT – STRESS STRAIN
The results show the stress and strain in the pipe after applying a pressure load of 2 psi. This means that if the pipe shown in the image were buried underground, the surrounding soil would exert a pressure of 2 psi on it. The analysis illustrates how much deformation or displacement occurs under this dirt pressure. The image shows that the middle section of the pipe experiences a maximum displacement of 3 mm, which is well within the acceptable range.
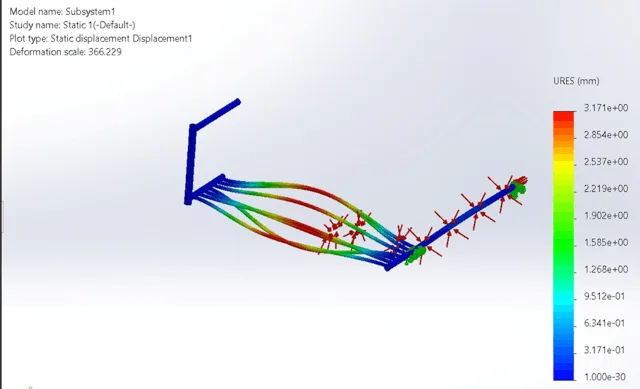
Displacement results after applying a pressure of 2 psi from all sides on the pipes – Click for source
CONCLUSIONS
Conclusions are crucial for understanding how the pipe responds to the applied pressure and for identifying the expected outcomes of the simulation.
- The same simulation was run for a double pipe (same model placed twice in series), and similar results were observed. A 3 mm displacement is not a concern, as it translates to approximately 0.1 inches. This means that when pipes are buried underground, they may shift by about 0.1 inches at the midpoint from their original position.
- Underground pipe joints function perfectly; movement only occurs in the middle sections of the long pipes.
- The deformation value is scaled for visualization purposes, which is why the pipe movement appears exaggerated in the image. In reality, the actual deformation is only 3 mm—very minimal and well within safe limits for the pipe.
- Conducting a stress-strain simulation for the entire model is unnecessary, as results are expected to remain consistent while significantly increasing simulation time.
THERMAL SIMULATION
To understand the temperature changes inside a greenhouse and in buried pipes 2.5 feet underground across different seasons and conditions, thermal simulation is the best option, considering assumptions, calculations, external factors, and boundary conditions.
ASSUMPTIONS
Assumptions play a crucial role in defining how the simulation is set up. They determine where convection, conduction, and radiation are present or absent, where temperature is applied directly, and about the thickness of the pipes. Assumptions provide detailed information about the conditions during the simulation.
- The greenhouse’s outside temperature is assumed to be the same as the surrounding atmospheric temperature, with no convection applied to the exterior surface. This means that the outside layer temperature of the greenhouse equals the atmospheric temperature, without considering wind or other surrounding effects.
- Regardless of outside conditions, no convection or radiation is considered—only the maximum and minimum temperatures are applied without any exponential variations.
- There is no sand effect on the pipes. Based on research, the outer surface of the pipe that is in direct contact with the soil maintains a fixed temperature, meaning there is no significant conduction effect or sudden temperature change on the pipe outside temperature.
- The pipe thickness increased from 0.0124 inches to 0.8 inches due to simulation time constraints. At 0.0124-inch thickness, the thermal simulation and meshing process in SolidWorks took over 20 hours for an assembly of six pipes.
- The entire greenhouse assembly was modified for simulation from 6-pipes to a 3-pipe configuration.
- Fans help with air circulation and enhance convection. Therefore, the convection coefficient remains consistent throughout the airflow generated by the fan movement.
- During the simulation, the convection value for the pipe was kept constant at 200 W/m²·K. This indicates that the fan was running at a constant speed throughout the simulation.
- There is no temperature transfer at the bottom of the greenhouse; in other words, there is no conduction between the ground and the bottom part of the greenhouse.
- There are eight different simulation cases, and during each simulation, no sudden changes in temperature or environmental conditions are considered.
CALCULATION / INFORMATION
Soil properties play a critical role in thermal simulations, as different soil types have varying capacities for temperature absorption. Additionally, the water content level significantly affects heat transfer from the surface to deeper layers, influencing the overall thermal behavior of the system.
This image illustrates different soil types categorized by their water content and thermal conductivity. These characteristics are essential inputs for calculations and simulations, as they directly influence how heat is transferred through the soil.
Note – This is just for understanding, as these properties were not used in the simulation. Including them would result in a significantly longer simulation time and would also require accounting for all natural environmental conditions, such as rain, strong winds, and hot summer temperatures.

Soil and temperature information
Three important factors affecting temperature at various underground depths:
- The exact depth at which temperature is measured.
- The proximity of geothermal heat sources.
- The proximity of groundwater.
In the simulation, it is assumed that there is no groundwater and that the underground temperature remains constant throughout the simulation period.
This image illustrates the temperature variation at different depths throughout the year, including ground surface, 2 feet, 5 feet, and 12 feet below ground.

Temperature for ground surface and underground temperature for 2, 5, and 12 feet
In the simulation, the greenhouse interior temperatures are 25°C (77°F), 21°C (69.8°F), 22°C (71.6°F), and 17°C (62.6°F). The tubing used in the system is made of PE (Polyethylene). Inside the greenhouse, air is circulated through buried pipes and re-enters with the help of a fan, indicating forced convection.
Before explaining further, it is important to understand the difference between natural and forced convection:
- Natural convection: Heat transfer occurs due to temperature differences without external forcing. The convection coefficient typically ranges from 5 to 25 W/m²·K.
- Forced convection: Air movement is induced by external means such as a fan or pump. The convection coefficient typically ranges from 20 to 300 W/m²·K.
For all simulations, the convection coefficient used is 200 W/m²·K.
Here’s what each symbol means:
- W (Watt): Unit of power, equal to 1 Joule per second (J/s).
- m² (square meter): Represents area.
- K (Kelvin): Represents temperature difference.
BOUNDARY CONDITIONS
Boundary conditions are crucial in simulation because they determine how and where external factors directly affect the model. For example, they define how much force is applied, where it is applied, which parts of the model remain fixed, and in which direction and on which side the model will move. If the simulation includes time steps—meaning that different amplitudes of movement or varying forces are applied over time—these are also defined within the boundary conditions.
Boundary conditions define how a model is constrained and where external effects are applied. This includes specifying which parts of the model are fixed, where forces or temperatures are applied, and whether any part of the model experiences rotation or movement. Essentially, all physical effects—such as force, pressure, movement, and temperature—are applied through the boundary conditions section in simulation software.
The image shows the parts of the model where the outside temperature is applied, such as the outer surface of the greenhouse and the pipes attached to it and located above ground. This temperature is applied in the boundary condition section of the simulation.

The Outer Body of Greenhouse and Pipes where surrounding Temperature Directly Applied – Click for source
The image illustrates the underground temperature at a depth of 2.5 feet, which represents the surrounding temperature of the buried pipe. This temperature is applied in the boundary condition section of the simulation.

Underground Temperature at 2.5 feet Which is Directly Applied on Underground Pipes
The image below illustrates convection between the inner surface of the greenhouse and the internal air, where airflow is driven by a fan and results from the temperature difference between the inside and outside of the greenhouse. This convection is applied in the boundary condition section of the simulation.

Convection Between Inside of Greenhouse and Indoor Air – Click for source
The image below illustrates convection between the inner surface of the pipe and the circulating air, also driven by the fan. This convection occurs inside the pipes due to the temperature difference between the pipe’s outer surface—buried at a depth of 2.5 feet—and the fan-induced airflow. This convection is applied in the boundary condition section of the simulation.

Convection Between Inside of Pipes and Fan Induced Airflow – Click for source
CASES FOR THERMAL SIMULATION
This section outlines eight different cases illustrating temperature scenarios before and after the simulation, focusing on the outside temperature (atmospheric temperature), the temperature at a depth of 2.5 feet (underground temperature taken from the reference paper), and the inside temperature of the greenhouse (desired temperature).

Eight Cases for Thermal Simulation, and their Temperature Condition Before and After Results – Click for source
There is one folder in the DROP BOX that contains a complete simulation with results, but it was created only for experimental purposes. It does not include the final eight thermal scenarios discussed above.
The eight cases below contain only the CAD models; they simply need to be opened in SolidWorks and run in SolidWorks Simulation without any additional setup to obtain similar results.
RESULTS
All the images below represent the temperatures of the two main parts of the greenhouse: the outside and the pipe. These temperatures can be easily interpreted using the temperature scale shown on the right side of each image.
1. WARMEST DAY OF SUMMER
The image below illustrates the warmest day of summer, where the outside temperature reaches a peak of around 36°C (96.8°F). The simulation reflects this as an instantaneous scenario. As a result, the greenhouse interior temperature also rises, since the underground temperature is approximately 5°C (41°F) cooler and the outside temperature is about 10°C (18°F) hotter compared to the greenhouse interior. This indicates the need for a cooling system. The simulation results support this explanation.

Warmest Day of Summer- Click for source
2. WARMEST NIGHT OF SUMMER
The image below illustrates the warmest night of summer. The surrounding temperature is 28°C (82.4°F), and the underground temperature is 24°C (75.2°F), both higher than the desired greenhouse interior temperature of 21°C (69.8°F). The simulation shows that the interior temperature increases under these conditions. A cooling system is therefore required, and the simulation results support this conclusion.

Warmest Night of Summer – Click for source
3. COLDEST DAY OF SUMMER
The image below represents the coldest day of summer. The underground temperature is 20°C (68°F), which is slightly lower than the desired greenhouse interior temperature of 22°C (71.6°F), while the surrounding air temperature is slightly higher at 25°C (77°F). Therefore, the battery system design provides moderate assistance in maintaining the internal greenhouse temperature, and no additional cooling system is required. The simulation results support this explanation.

Coldest Day of Summer – Click for source
4. COLDEST NIGHT OF SUMMER
The image below illustrates the coldest night of summer. The underground temperature is 20°C (68°F), while the surrounding air temperature is 23°C (73.4°F), which is close to the desired interior greenhouse temperature of 22°C (71.6°F). On this day, the climate battery design plays a major role in maintaining thermal balance, and no additional cooling system is required. The simulation results support this explanation.

Coldest Night of Summer – Click for source
5. WARMEST DAY OF WINTER
The image below represents the warmest day of winter, where the outside temperature is 30°C (86°F) and the underground temperature is 10°C (50°F), both significantly different from the desired greenhouse interior temperature of 17°C (62.6°F). In this scenario, the climate battery design plays a crucial role in maintaining the internal temperature. The simulation results support this explanation.

Warmest Day of Winter – Click for source
6. WARMEST NIGHT OF WINTER
The image below illustrates the warmest night of winter. Both the outside temperature, 12°C (53.6°F), and the underground temperature, 10°C (50°F), are lower than the desired greenhouse interior temperature of 17°C (62.6°F). In this scenario, the battery design alone is not sufficient—an additional heating system is required due to the considerable temperature gap between the desired indoor conditions and the external heat sources. The available heat from both the ground and surrounding air is inadequate to maintain the target temperature. The simulation results support this explanation.

Warmest Night of Winter – Click for source
7. COLDEST DAY OF WINTER
The image below represents the coldest day of winter. Both the outside temperature, 4°C (39.2°F), and the underground temperature, 10°C (50°F), are significantly lower than the desired interior temperature of the greenhouse, which is 17°C (62.6°F). In this scenario, the battery design is not sufficient—an additional heating system is essential due to the large temperature difference between the desired condition and the available heat sources (outside air and ground). The simulation results support this explanation.

Coldest Day of Winter – Click for source
8. COLDEST NIGHT OF WINTER
The image below represents the coldest night of winter. Both the outside temperature, 7°C (44.6°F), and the underground temperature, 10°C (50°F), are significantly lower than the desired greenhouse interior temperature of 17°C (62.6°F). In this scenario, the battery design is not sufficient—an additional heating system is essential due to the large temperature gap between the desired indoor environment and the available thermal sources. The limited heat from the ground and surrounding air cannot adequately maintain the target temperature. The simulation results support this explanation.

Coldest Night of Winter
CONCLUSIONS
This section explains how temperature plays a crucial role, highlighting the importance of conduction and convection in the greenhouse, and how these processes influence the internal temperature.
- The basic thermodynamic principle is effectively demonstrated, as the underground temperature plays a significant role in helping maintain the internal temperature of the greenhouse.
- The assumptions are important because simulation and meshing are time-sensitive processes. Applying all real-world conditions with the original pipe thickness would significantly increase simulation time.
- The main challenge arises during peak winter, as the underground temperature at 2.5 feet is around 10°C (50°F) and the outside temperature drops to 7°C (44.6°F) or 4°C (39.2°F), while the greenhouse interior needs to be maintained at 17°C (62.6°F) to 21°C (69.8°F). Achieving this temperature difference is difficult under such conditions.
- The same condition will repeat on the warmest days and nights of summer, as the inside temperature continues to rise. As a result, the internal temperature has already increased by 1°C (33.8°F) during summer [Based on Simulation Results], indicating the need for a cooling system.
- The outside temperature and underground temperature remain nearly the same because both act as large thermal reservoirs. However, they may temporarily fluctuate in response to changes in the greenhouse temperature.
- The pipe thickness was changed due to simulation and time constraints. If a higher-power computer were available, the results might have been more precise.
- We believe that during winter, external heating—either through electric heaters or passive solar gain—may be necessary to maintain the desired greenhouse temperature. Similarly, in summer, external cooling is essential. In both specific scenarios, the battery design alone is not sufficient to regulate the internal temperature effectively.
HVAC ANALYSIS FOR TEMPERATURE MAINTENANCE
This section explains how different temperature setpoints (30 °C, 24 °C, and 0 °C) affect the heating and cooling demands of the greenhouse. It highlights how ground temperature, airflow, and environmental loads determine when fans alone are sufficient and when external HVAC systems are required.
MAINTAIN 30 °C (86 °F)
- Summer ground ≈ 22–24 °C; winter ground ≈ 4–12 °C.
- For the July example, we computed: average ~0.30 vol/min to hold 30 °C ⇒ fans are enough for solar, but size to ≥0.75 vol/min for stability/peaks.
The image below shows when external heating and cooling are required to maintain a temperature of 30 °C (86 °F) inside the greenhouse, and what measures should be prepared to sustain the greenhouse’s internal temperature.
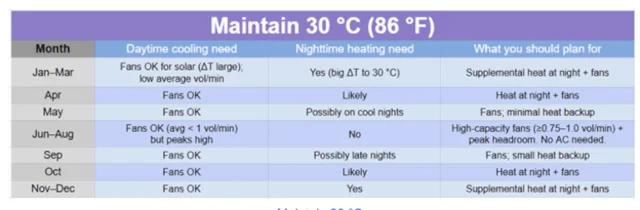
Click for Spreadsheet
MAINTAIN 24 °C (75.2 °F)
- Summer ground ≈ 22–24 °C; winter ground ≈ 4–12 °C.
- For the July example, we computed: ~1.22 vol/min average (≈ 41k CFM) to hold 24 °C with ground ~22 °C → peaks ~2.4 vol/min ⇒ fans alone are often insufficient.
The image below shows when external heating and cooling are required to maintain a temperature of 24 °C (75.2 °F) inside the greenhouse, and what measures should be prepared to sustain the greenhouse’s internal temperature.
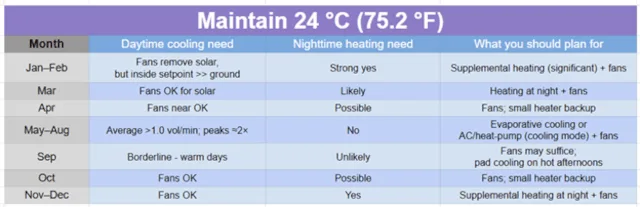
Click for Spreadsheet
MAINTAIN 0 °C (32 °F)
- The ground is warmer than 0 °C almost the entire year (≈ 4–24 °C). Holding 0 °C is a cooling problem, not a heating one, except during extreme cold snaps.
- July example – climate battery air (~22 °C) is 22 K warmer than setpoint → you’d be adding heat unless you actively cool.
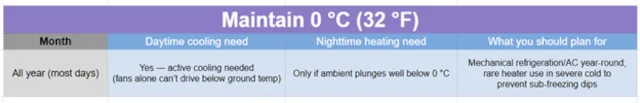
Click for Spreadsheet
Bottom line (0 °C) :
- Expect mechanical refrigeration most of the year. This setpoint is unusual for greenhouses.
Equipment guidance :
- Fans (baseline) – Install to ≥ 0.75–1.0 vol/min (≈ 25k–34k CFM for your volume), with peak headroom (~×2) to avoid temperature spikes on clear summer days.
- Evaporative pads – Very effective in May–Aug for a 24 °C setpoint in Utah’s dry summer; size pad/fan package for peak CFM from the tables you generated.
- Heat source – For 30 °C and 24 °C setpoints, you’ll need backup heat Nov–Mar nights (Oct/Apr shoulder). Choose propane, electric, or a heat-pump (heating mode). Heater BTU/hr can be tabulated using glazing U-values + ACH from Tables 2–4 for chosen design-night ΔT.
ONE COMMUNITY’S CLIMATE BATTERY DESIGN
The three images below illustrate the layout of the battery design, including the pipe connections, inlet and outlet positions, the two types of tubing (Near Tubing and Far Tubing), the two piping layers, and a side view of the greenhouse.

Diagram showing how pipes are connected

Side view of the greenhouse

Diagram showing inlets, outlets, and the two types of tubing (Near Tubing and Far Tubing)
TUBING
One Community’s climate battery will have two layers of tubing. Each layer will have 6 separate systems with one fan per system, for a total of 12 fans, as illustrated above. This number of fans gives an adequate flow rate for the greenhouse.
A flow rate of 250 CFM per system for a total of 3000 CFM has been selected. For a 33,000 ft3 greenhouse this CFM gives an air change hourly rate (ACH) of 5.4, which is within the rule of thumb range of 5-10.
The tubing will be HDPE with 12in diameter manifold tubing (a collection of parallel pipes that facilitates the transportation of air) and 6in diameter tubing for the rest. The tubing systems will be slightly different based on their location in respect to the greenhouse. The systems closer to the greenhouse structure will have 7 tubes and the farther systems that will have 6. This is to compensate for the extra length and consequent pressure drop.
This difference will equalize the total length of tubing and therefore equalizes the pressure drops between the two systems. Having a similar pressure drop means the two systems should perform the same, which is beneficial for maintaining and monitoring.
| System 1 (near) | System 2 (far) | |||||
| # of tubes | cfm per tube | tubing length | # of tubes | cfm per tube | tubing length | |
| 7 | 30.6 | 203.568 | 6 | 35.7 | 174.48 | |
This configuration gives a maximum pressure drop of 5 inwg (inches water, a standard unit of pressure in the HVAC industry). More information for pressure drop and tubing length calculations can be found in the resources below.
BURIAL DEPTH
Below is an image of the SCAN database for Circleville, UT (a site at 6120 ft elevation) which provides information on the hourly air temperature and hourly soil temperature at -2in, -4in, -8in, -20in, and -40in (~1m). As previously mentioned, the necessary conditions for the appropriate depth to bury the climate battery tubes are:
- Difference in soil temperature at surface and underground temperature is greater than 10°F.
- Underground temperature needs to be constant year-round.
These conditions are achieved around -3.3 feet (-40 inches), so the climate battery tubes should be buried at approximately 3.3 feet below the surface.

CONTROLS, SENSORS, AND AUTOMATION
This section focuses on controls, sensors, and automation, including thermostat, fans, humidity sensors, and wiring.
THERMOSTAT
- Circulation Fans – Connected to thermostat
- One side a passive louver/shutter will open when the exhaust fan is in operation
- Climate Battery
- Ground/air temperature sensor
HUMIDITY SENSORS
- Sprayer
- Humidity sensor hooked up to an electric solenoid from a garden hose connected to a misting line
- Humidity sensor
- Electrical
- Waterproofed and grounded
- Silicon wiring with temperature rating >150°F
ONE COMMUNITY’S CLIMATE BATTERY BUILDING PLAN
We have two options based on all the above research. Option one is to expect the climate battery system to work perfectly regardless of the lack of an accurate mathematical model and based on the assumption that it has worked great for many other people (see the examples of Working Climate Batteries section above).
If we go this route, we’ll build the first structure and climate battery and gather data to validate its overall effectiveness and cost effectiveness. Then we would decide if we’d like to install it in the remaining greenhouses.
The second option is to continue to run further analyses so we can validate the model sufficiently to feel more comfortable building the complete Aquapini/Walipinis plan. These additional analyses and simulations will be based on…
MAXIMALLY-AFFORDABLE WALIPINI
GREENHOUSE DESIGN ELEMENTS AND PLANS
Here are some extra non-climate battery information that should be understood and need to be further researched for development/integration into the final design.
GREENHOUSE DESIGN ELEMENTS
The figure below shows the minimum and maximum seasonal temperature changes of different areas in the US.

Figure 8. US Seasonal Average Temperature Map – Click for source
The following table show the minimum and maximum temperatures recorded for different states in the US.

Figure 9. Extreme Temperatures Recorded for Different States – Click for source
PLANT GROWTH
In terms of the growth of plants, the best soil for a greenhouse is a mix of loam soil with compost and potting mixture. To be specific, loam soil is the composition of sand, silt, clay, and humus. Humus functions to help the growth of vegetables and contains organic elements including decayed leaves and animal fertilizer to retain moisture and nutrients.
The optimal proportion of soil mix is 60% loam soil, 30% compost, and 10% potting mix. If the quality of local soil is not qualified because of its relatively low nutrients, a soil mix made of half potting mix and half compost mixture would be sufficient for greenhouse plant growing.
OTHER ENVIRONMENTAL CONTROLS
Other environmental conditions, such as humidity, ventilation, and circulation, may also need to be controlled, as described in the following sections.
HUMIDITY CONTROL
At various times during the year, humidity may need to be controlled in the greenhouse. When the humidity is too high at night, it can be reduced by adding heat and simultaneously ventilating. When the humidity is too low during the day, it can be increased by turning on a fog or mist nozzle.
WINTER VENTILATION
During the winter, houses are normally enclosed tightly to conserve heat, but photosynthesis by the plants may lower the carbon dioxide level to such a point that it slows plant growth. Some ventilation helps maintain optimum internal carbon dioxide levels. A normal rate of airflow for winter ventilation is 10 to 15 L/s per square meter of floor area.
AIR CIRCULATION
Continuous air circulation within the greenhouse reduces still-air conditions that favor plant diseases. Recirculating fans, heaters that blow air horizontally, and fans attached to polyethylene tubes are used to circulate air. The amount of recirculation has not been well defined, except that some studies have shown high air velocities (greater than 1.0 m/s) can harm plants or reduce growth.
Vertical closed-loop earth heat exchangers are installed in boreholes 200 to 300 feet deep, where seasonal changes in soil temperature are completely damped out. Well-based open-loop systems also extend to this depth or deeper. These ground loop configurations are thus exposed to a constant year-round temperature.
On the other hand, horizontal-loop, spiral-loop, and horizontal direct-expansion (DX) loops are installed in trenches that usually are less than 10 feet deep. For these types of ground loops, it is important to accurately know the expected seasonal changes in the surrounding soil temperature. The extra cost of installing systems in deeper trenches may be outweighed by the gain in thermal performance since deeper soils have less pronounced seasonal temperature changes and are thus closer to room temperature, which reduces the work load of the heat pump units.
NATURAL VENTILATION
The principles of natural ventilation are explained in Chapter 16 of the 2013 ASHRAE Handbook” Fundamentals. Its suitability as a primary means of cooling must be judged and designed based on local environmental conditions, the type of crop grown, and the design of the greenhouse.
Radiation energy exchange is also important. Solar gain can be estimated using the procedures outlined in Chapter 18 of the 2013 ASHRAE Handbook Fundamentals. Radiation loss must also be calculated and accounted for.
COST ANALYSIS
The financial sustainability of an open-source climate battery system is rooted in balancing initial capital investment with long-term energy savings. This structured cost analysis framework is designed to support budgeting for 2,000 sq. ft. greenhouse applications (Walipini/Aquapini-style) by breaking down expenses into capital, installation, and operational categories. Key cost drivers include burial depth, desired airflow rates, and insulation quality, each of which presents specific trade-offs between upfront expenditure and long-term thermal stability. The following detailed breakdowns provide a roadmap for project planning and open-source replication.
INTRODUCTION
This introductory sheet serves as the navigational anchor for the budget. It defines the project scope, intended greenhouse scale (Medium/2,000 sq. ft.), and the standardized formatting used throughout the analysis to ensure data clarity and stakeholder alignment.

Figure 1. Read Me – Click for source
TOTAL COST SUMMARY
The summary provides an executive roll-up of the total capital investment, including a 15% contingency for site-specific variations and a 10% buffer for tax and shipping.

Figure 2. Summary – Click for source
CORE DESIGN ASSUMPTIONS
This section outlines the baseline parameters for a medium-sized system, such as the 3.3 ft burial depth and the 12-fan configuration required to meet a 5.4 Air Change Rate (ACH).

Figure 3. Assumptions – Click for source
TUBING MATERIALS
As the “veins” of the system, tubing represents a critical investment in heat exchange efficiency, covering perforated HDPE pipes, manifolds, and silt-preventative filter socks.

Figure 4. Tubing Materials – Click for source
EXCAVATION & SOIL BACKFILL
This tab details the costs associated with heavy machinery and earth movement, which are highly dependent on local soil types and site accessibility.

Figure 5. Excavation and Soil Backfill – Click for source
THERMAL INSULATION
The insulation strategy focuses on creating a thermal “envelope” using high-density EPS foam and vapor barriers to prevent heat from leaking into the surrounding ground.

Figure 6. Insulation – Click for source
FANS & AIRFLOW INFRASTRUCTURE
Moving air through high-resistance underground pipes requires specialized high-static fans, backdraft dampers, and intake filter boxes to maintain consistent performance.

Figure 7. Fans and Airflow – Click for source
CONTROLS, SENSORS & AUTOMATION
The “brain” of the climate battery utilizes differential controllers and buried thermocouples to automate fan operation based on real-time temperature differences.

Figure 8. Controls and Sensor – Click for source
SKILLED & GENERAL LABOR
Successful implementation requires a mix of skilled electrical trades for control wiring and general labor for the complex assembly of the 12-zone manifold system.

Figure 9. Labor – Click for source
ANNUAL OPERATING ENERGY COST
This recurring utility analysis helps calculate the long-term ROI by projecting electricity consumption based on a 60% fan duty cycle.

Figure 10. Operating Energy Cost – Click for source
MAINTENANCE & LIFECYCLE
To ensure the system reaches its 50-year design life, this budget accounts for recurring costs such as filter replacements and periodic fan motor inspections.

Figure 11. Maintenance and Lifecycle – Click for source
RESOURCES
- One Community Climate Battery Website Info – Resources
- Climate Battery Greenhouse: Energy Efficient and Sustainable Winter Growing
- Eco Systems Design Inc. Climate Battery Functions
- Eco Systems Design Inc. Climate Battery Calculator Version 2.0
- Low Grade Geothermal Heating and Cooling for Greenhouses – ZipGrow Inc.
- Greenhouse Forum at Permies.com: Small, above ground climate batteries?
- Resource of Resources: Their Consulting – Atmos Greenhouse Systems
- Ground to Air Heat Transfer – GHAT Greenhouse System – Ceres
- Garden Web Discussions: Is anyone using a shcs in a cold climate?
- Garden Web Discussions: Any updates on data from those with SHCS greenhouses?
- Garden Web Discussions: Subterranean Heating/Cooling System
- Renewable Energy Solutions – Jumping Cable Solar Homes
- KnowledgePublications – Heating and Cooling Your Home
- Citrus in the Snow – Geo Air Technology
- Building a Solar Greenhouse with the Subterranean Heating and Cooling System
- Passive Solar for Heating and Air Treatment
- Article: “Working Parameters Affecting Earth-air Heat Exchanger (EAHE) System Performance for Passive Cooling”
- Definition: “Reynolds Number”
- Greenhouse Ventilation – UF askifas
- Threefold Farm – Climate Battery Greenhouse Version 2
- Eco Systems Design Inc. Climate Battery FAQ
- The Leader in High Altitude Forest Gardening and Near Net-zero Greenhouse Design for Over 30 Years
- Threefold Farm – Climate Battery Greenhouse Version 1 aka The Gray House
- Chapter 13: HVAC Applications for PE Pipe
- ADS Single Wall Heavy Duty Pipe Specification
- NWCC Report Generator – Circleville (2125) Utah SCAN Site – 6120 ft Reporting Frequency- Hourly; Date Range- 2019-01-01 00-00 to 2019-01-31 23-00
- Article: “Study on Calculation Models of Earth-Air Heat Exchanger Systems”
- 10 Do’s And Don’ts For Designing A Ground To Air Heat Transfer System
- Article: “Improving the performances of earth air heat exchangers through Constructal design”
- USGS FAQ – How can I find the depth to the water table in a specific location?
- Home Advisor – How Much Does It Cost to Excavate?
- Wikipedia: “Reynolds Number”
- Food Autonomy w/ Evan Doukas/ How To Build A Climate Battery Greenhouse ” SOLE
- Climate Battery – An Improved Greenhouse Climate Solution
- Ground Temperatures as a Function of Location, Season, and Depth – Build It Solar
- Article: “What Is The Best Soil For Greenhouse Plants?”
- McGill AirFlow Duct System Design Guide First Edition
- Article: “Thermal Conductivity, Thermal Diffusivity, and Thermal Capacity of Some Nigerian Soils”
- How to Size Greenhouse Fans & Shutters – RIMOL Greenhouse Systems
- How to Read a Fan Performance Curve – G Squared Engineered Products
- Article: “Fans: Airflow versus Static Pressure”
- Air Density Correction Factors Table
- Fan Engineering – Temperature & Altitude Effects on Fans
- Designing Air Flow Systems – Air Flow, Air Systems, Pressure, and Fan Performance
- Fan Basics – Air Flow, Static Pressure, and Impedance
- SmartBee➢ Controllers – The Best Automated Grow Systems for Home
- Environmental Controls – Greenhouse Megastore
- Smart Greenhouse Climate and Control Systems – Postscapes
- 2015 ASHRAE Handbook: Heating, Ventilating, and Air-Conditioning APPLICATIONS
- 2018 ANSI/ASHRAE/ACCA Standard Practice for Inspection and Maintenance of Commercial Building HVAC Systems
- One Community Climate Battery Website Info – Resources – Heating and Ventilation
- Chapter 28: Nonresidential Cooling and Heating Load Calculations
- USDA NWCC Report Generator 2.0
- Daily Solar Energy Calculator – Fabhabs
- Window Heat Gain Calculator
- Average Weather in January in Los Angeles, California, United States – Weather Sparks
- The Weather Year Round Anywhere on Earth – Weather Sparks
- Wikipedia: “High-density polyethylene”
- Article: “Determination of Thermal Conductivity of Coarse and Fine Sand Soils”
- Average Weather on January 15 in West Jordan, Utah, Unites States – Weather Sparks
- NWCC Report Generator – Circleville (2125) Utah SCAN Site – 6120 ft Reporting Frequency- Hourly; Date Range- 2019-08-15 00-00 to 2019-08-31 23-00
- USDA National Water and Climate Center: Soil Temperature (8 in.) Percent of POR Median November 29, 2022, end of day
- Records – State Climate Extremes Committee (SCEC) | National Centers for Environmental Information
- USA State Temperatures Mapped For Each Season – Current Results
- ASHRAE Handbook Volumes Online
- Article – Underground Pipe Earth Pressure
- Article – How does the subsurface earth temperature vary around the world?
- Article – Natural Convection
- Article – Forced Convection
- Article – Measurements of Ground Temperature at Various Depths
- Article – Climate of Dallas
- Use this page (click here) if you have a resource you’d like to suggest be added here.
CLIMATE BATTERY BOOKS
- The Year-Round Solar Greenhouse: How to Design and Build a Net-Zero Energy Greenhouse by Lindsey Schiller and Marc Plinke
- The Forest Garden Greenhouse: How to Design and Manage an Indoor Permaculture Oasis by Jerome Osentowski
SUMMARY
A climate battery is an innovative and sustainable design for heating and cooling. Using their geothermal energy system, climate batteries regulate air temperature and humidity and ultimately serve to provide more reliable, efficient, and sustainable heating and cooling solutions for greenhouses, homes, and non-residential buildings. We have researched many resources to make our designs replicable, durable, and easy to build. These open source tutorials will be used and evolved as we construct everything on this page and more as part of our Aquapini/Walipinis and Tropical Atrium.
FREQUENTLY ANSWERED QUESTIONS
Q: Is this guide complete?
No, we do not consider this guide complete yet. We need to complete more research and even then this design will not be considered complete by us until we build our own climate battery and test it. We’ll share the plans and results when we have them. We will also share anything new we learn during the process.
- Use this page (click here) if you have a question you’d like to suggest be added here
![]()