One Community
Aquapini and Walipini Lighting, Shading, and Thermal Mass Research and Design
This page is the open source project-launch blueprinting page specific to the free-sharing and global collaboration regarding the One Community Walipini, Aquapini, and Zen Aquapini lighting, shading, and thermal mass details. These structures will adhere to our botanical garden guidelines while demonstrating 4 distinctly different growing zones that will produce a combination of quality, volume, and food diversity that significantly exceeds what is available in most grocery stores. For more general information on these structures, visit the Aquapini and Walipini Open Source Project-launch Blueprinting Hub For more general information, visit the Open Source Highest Good Food Project-launch Blueprinting Hub.
We discuss the Walipini, Aquapini, and Zen Aquapini lighting, shading, and thermal mass details with the following sections:
- Related Pages
- What is a Walipini, Aquapini & Zenapini
- Why Build Aquapinis & Walipinis
- Resources
- Summary
- FAQ
NOTE: THESE DESIGNS STILL NEED WORK. THIS PAGE IS NOT CONSIDERED BY US TO BE
A COMPLETE AND USABLE TUTORIAL UNTIL WE BUILD AND TEST THE AQUAPINI AND ADD
ALL THE RELATED VIDEOS AND EXPERIENCE FROM THAT BUILD TO THIS PAGE. IN THE MEANTIME, WE WELCOME YOUR INPUT AND FEEDBACK AND INVITE YOU TO JOIN THE TEAM AND HELP FINISH THE DESIGNS IF OPEN SOURCE AQUAPINI/WALIPINI DESIGN IS SOMETHING YOU ARE INTERESTED IN
RELATED PAGES (Click icons for complete pages)








WAYS TO CONTRIBUTE TO EVOLVING THIS SUSTAINABILITY COMPONENT WITH US
SUGGESTIONS | CONSULTING | MEMBERSHIP | OTHER OPTIONS
CLICK HERE TO HELP US FINISH THE OPEN SOURCE DESIGNS FOR THESE STRUCTURES
WHAT ARE LIGHTING, SHADING, AND THERMAL MASS?
 Content coming….
WHY ARE LIGHTING, SHADING, AND THERMAL MASS IMPORTANT?
Coming…
WAYS TO CONTRIBUTE TO EVOLVING THIS SUSTAINABILITY COMPONENT WITH US
SUGGESTIONS | CONSULTING | MEMBERSHIP | OTHER OPTIONS
Avery Ellis: Aquaponics Specialist and owner/operator of Integrated Aquaponics
Bear Stauss: Horticulturalist and Landscape Design/Recreation Area Management Specialist
Bupesh Seethala: Architectural Drafter & Designer, BS Electrical Engineering (BupeshSeethala.com)
Charles McLean: Architecture & Urban Agriculture Designer, Professor, and owner of OM Greengroup
David Sweet: Architect (DSweet.biz)
Daniela Andrea Parada: Civil Engineering Student
Diana Gomez: Mechanical Engineer
Douglas Simms Stenhouse: Architect and Water Color Artist
Gayatri Pandkar: Architect
Henry Vennard: Mechanical Engineer
Japneet Kour: Volunteer Architect
Jiayu Liang: Landscape Designer
Kim Braman: Apiary and Beekeeping Expert
Mohammad Almuzaial: Civil and Construction Engineer
Ron Payne: HVAC / Thermal Designer, Mechanical Engineer
Silin Wang: Landscape Designer
Vatsal Tapiawala: Mechanical Engineer
Zdenek Jurik: P.E. Structural, Civil and Mechanical Engineer and founder of ABC Engineering
SUSTAINABILITY COMPLIANCE
Ensuring sustainability compliance is crucial for minimizing environmental impact and maximizing energy efficiency in the greenhouse. The selected lighting solutions align with sustainability goals by prioritizing energy conservation, responsible sourcing, and environmental adaptability.
- Energy Efficiency: The chosen fixtures are ENERGY STAR certified, ensuring they meet stringent energy efficiency standards.
- Sustainable Sourcing: Company is committed to producing environmentally friendly lighting solutions, with a focus on durability and reduced environmental impact.
- Environmental Suitability: The fixtures are designed to operate efficiently in greenhouse conditions, withstanding high humidity and temperature fluctuations, ensuring long-term viability and minimal environmental impact.
The lighting strategy not only prioritizes energy efficiency and environmental adaptability but also supports the greenhouse’s mission to cultivate endangered and vulnerable species. By balancing natural and artificial lighting, we create an environment that maximizes plant growth while minimizing energy consumption. This dual focus on sustainability and biodiversity preservation ensures that the greenhouse operates as a model for eco-friendly agriculture.
INTEGRATION OF SOLAR AND ARTIFICIAL LIGHTING
The lighting design for Greenhouses strategically combines natural and artificial lighting to create a balanced and energy-efficient environment for plant growth. This approach leverages the abundant natural sunlight available during peak hours while supplementing it with artificial lighting during periods of reduced solar availability, ensuring consistent light levels throughout the year.
BASED ON THE SUN STUDY AND CLIMATE ANALYSIS
A comprehensive analysis of solar patterns and climatic conditions informs the integration of lighting solutions in the greenhouse. This ensures optimal use of natural sunlight while effectively addressing periods of reduced solar availability to maintain plant health and productivity.
- Natural Light Utilization: Solar studies confirm optimal sunlight from 9:15 am to 5:35 pm on December 21st, ensuring adequate natural light penetration. The orientation and placement of the Greenhouse structures maximize sunlight exposure, reducing the need for artificial lighting during peak sunlight hours.
- Supplementary Artificial Lighting: During periods with higher cloud cover (e.g., January to March and November to December) or lower direct sunlight (as indicated by radiation charts), supplementary artificial lighting will be used to ensure the plants receive sufficient light for optimal growth.
The use of supplemental lighting is particularly critical for the cultivation of endangered, vulnerable, and rare species within the greenhouse. These plants often have highly specific light requirements that cannot be fully met by natural light alone, even in high-altitude locations with intense sunlight. By investing in supplemental lighting, we ensure optimal growing conditions that support their survival, health, and productivity. This approach aligns with our mission to preserve biodiversity and promote food security, making the additional energy use a justifiable and necessary investment.
ENERGY USAGE AND SOLAR STRATEGY
To create a sustainable and energy-efficient environment within Greenhouse, the energy usage and solar strategy are designed to minimize reliance on external energy sources by optimizing the use of natural sunlight. This strategy focuses on synchronizing artificial lighting with solar availability and exploring the potential integration of solar energy to support lighting needs during low sunlight periods.
- Energy Requirements: The calculation of energy usage will be based on periods with low sunlight availability. Lighting will be optimized to align with natural light cycles, minimizing energy consumption.
- Integration Strategy for Solar Usage: Future integration will involve monitoring solar radiation data and adjusting lighting schedules to optimize energy use. Solar panels may be installed to support lighting during peak usage times, particularly during months with lower natural light levels.
ADDITIONAL RECOMMENDATIONS:
- Implement an intelligent control system that dynamically adjusts artificial lighting based on real-time measurements of natural light levels, further optimizing energy use.
- Tailor light spectra for different plant growth stages, as research shows this can improve growth and energy efficiency.
- Explore using renewable energy sources, such as solar power, for overall greenhouse operations to reduce the project’s carbon footprint.
- Implement energy monitoring and management systems to track and optimize energy use over time.
- Continuously monitor plant responses and energy consumption data, adjusting strategies as needed to maintain optimal growth conditions and energy efficiency.
By leveraging renewable energy sources, we aim to further reduce the greenhouse’s carbon footprint and enhance its sustainability. Additionally, we will continuously monitor energy usage and plant responses, allowing us to fine-tune the system over time and explore additional renewable energy solutions.
These strategies and recommendations align with current research on sustainable greenhouse operations and have the potential to significantly enhance the energy efficiency and overall sustainability of the Greenhouse project.
CONCLUSION
The lighting design for the greenhouse not only meets the diverse needs of the plant species but also aligns with our commitment to sustainability and biodiversity preservation. By leveraging natural light, energy-efficient fixtures, and intelligent control systems, we create an environment that supports optimal plant growth while minimizing environmental impact. As we move forward, we will continue to refine the system, integrate renewable energy solutions, and share our findings to advance sustainable agriculture practices.
DESIGN OUTCOMES AND PERFORMANCE
The lighting design for the greenhouse effectively addresses the specific needs of various plant species while ensuring compliance with sustainability criteria. The chosen fixtures provide the necessary light intensity and spectrum for all zones, all while meeting energy efficiency and sustainability standards.
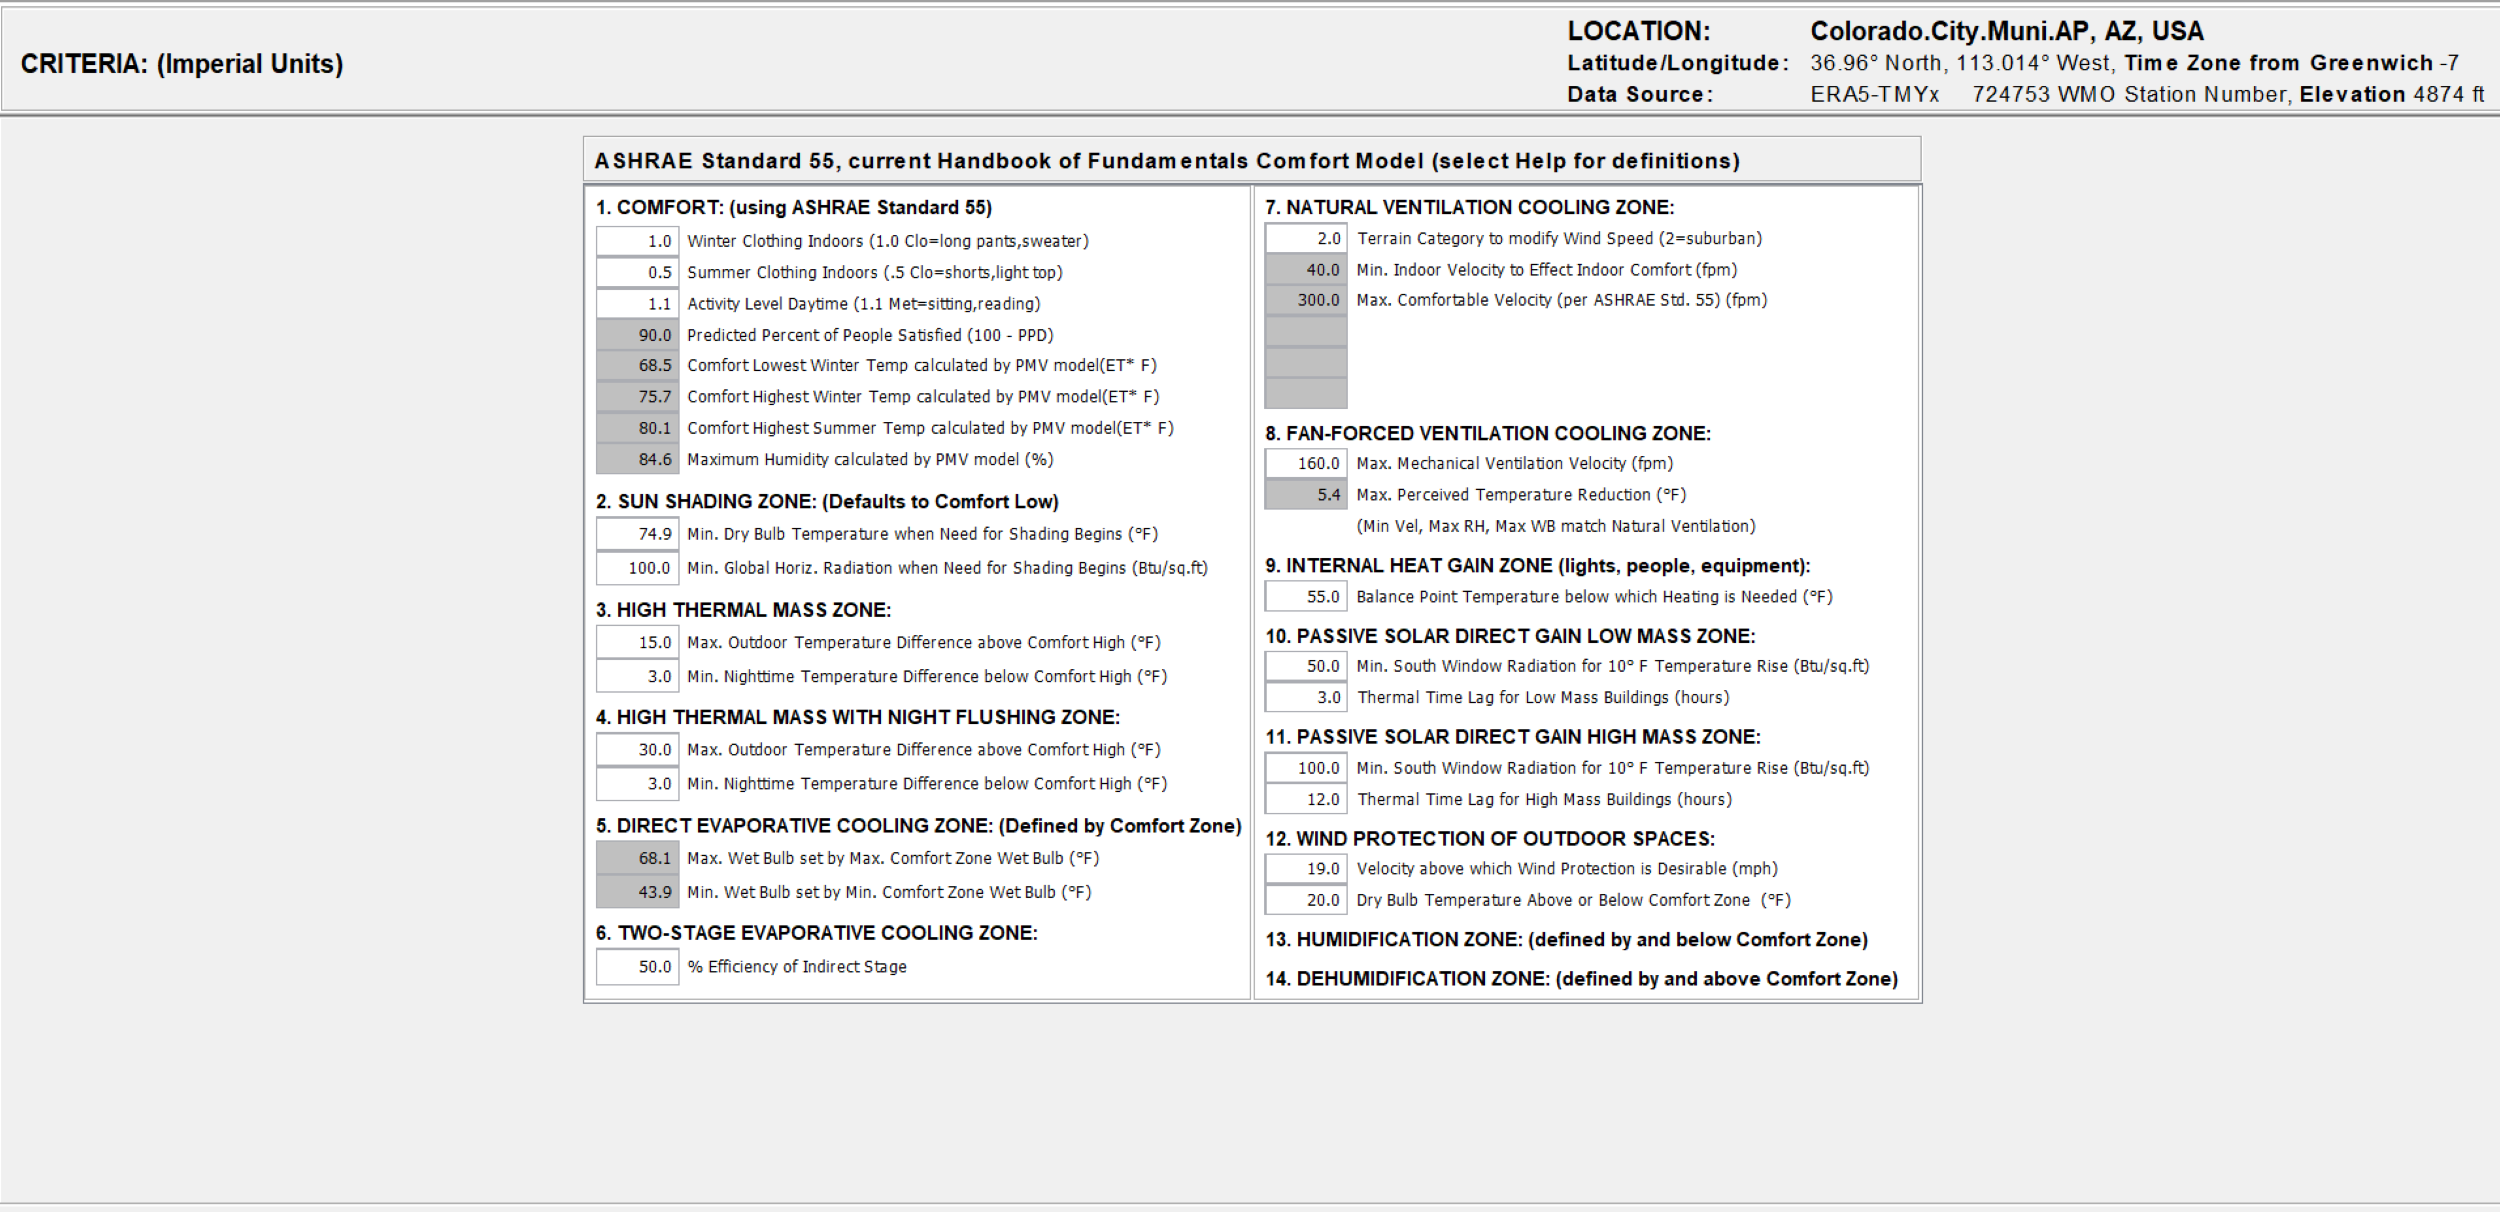
ASHRAE Standard 55 comfort criteria and zones for sustainable greenhouse design – Click to enlarge
Here is an explanation of the various criteria shown in the ASHRAE Standard 55 section and other categories from the Climate Consultant software output:
Note: The project site is at 6000 ft which is 1126 ft higher than the weather station. Adjustments needed:
- Temperature: Approximately 3.9°F cooler
- Solar Radiation: Higher intensity
- Humidity: Generally lower
- Air Pressure: Lower
COMFORT ZONE
The concept of a “Comfort Zone” revolves around creating indoor environments that promote thermal comfort for occupants. This involves balancing factors such as clothing insulation, activity levels, temperature ranges, and humidity levels to ensure optimal satisfaction. Below, we explore key elements that define the comfort zone, including the thermal insulation provided by clothing, metabolic rates during activities, predicted satisfaction levels, comfortable temperature ranges, and acceptable humidity levels. These factors are essential for designing spaces that cater to human comfort in both winter and summer conditions.
- Winter and Summer Clothing Indoors: This indicates the thermal insulation levels provided by clothing, measured in Clo units, where 1.0 Clo represents heavy clothing (like a winter coat), and 0.5 Clo represents lighter clothing suitable for summer.
- Activity Level Daytime: Measured in Met units (metabolic rate), this represents the energy produced by a person while performing various activities. For example, 1.1 Met corresponds to light activities such as sitting or reading.
- Predicted Percent of People Satisfied (PPD): A comfort metric indicating the percentage of occupants likely to feel thermally comfortable in the given conditions. A PPD of 90% means 90% of people are predicted to be comfortable.
- Comfort Temperatures (Lowest, Highest): The range of temperatures calculated by the PMV (Predicted Mean Vote) model that occupants find comfortable. These are specific to winter and summer settings.
- Maximum Humidity Calculated by PMV Model: The highest level of humidity at which people are predicted to feel comfortable according to the PMV model.
SUN SHADING ZONE
The “Sun Shading Zone” focuses on managing solar heat gain and radiation to maintain indoor thermal comfort and energy efficiency. By understanding the thresholds for temperature and solar radiation, we can determine when shading devices, such as blinds, louvers, or overhangs, should be deployed to prevent overheating and reduce cooling loads. This zone is critical for optimizing building performance and ensuring occupant comfort, particularly in climates with intense sunlight. Below are the key parameters that define the need for sun shading:
- Min. Dry Bulb Temperature When Need for Shading Begins: The minimum temperature at which shading becomes necessary to prevent overheating inside the building.
- Min. Global Horizontal Radiation: The minimum level of solar radiation received horizontally at which shading devices should be used to maintain comfort.
HIGH THERMAL MASS ZONE
Max and Min Temperature Difference Above/Below Comfort High: This shows the allowable temperature range where high thermal mass materials can help stabilize indoor temperatures by storing heat during the day and releasing it at night.
HIGH THERMAL MASS WITH NIGHT FLUSHING ZONE
Similar to the High Thermal Mass Zone but with provisions for night flushing (ventilation) to cool the building using cooler outdoor night air.
DIRECT EVAPORATIVE COOLING ZONE
Max and Min Wet Bulb Temperatures: These define the temperatures where direct evaporative cooling is effective. Direct evaporative cooling adds moisture to the air to reduce temperature, which works well in hot and dry climates.
TWO-STAGE EVAPORATIVE COOLING ZONE
Percentage% Efficiency of Indirect Stage: Measures the efficiency of the indirect stage of two-stage evaporative cooling, which uses a heat exchanger to cool the air without adding moisture.
NATURAL VENTILATION COOLING ZONE
Specifies the terrain type, minimum and maximum indoor air velocity, and other conditions for natural ventilation to provide comfort.
FAN-FORCED VENTILATION COOLING ZONE
Describes mechanical ventilation parameters like maximum velocity and perceived temperature reduction to cool indoor spaces.
INTERNAL HEAT GAIN ZONE
Balance Point Temperature Below Which Heating is Needed: The outdoor temperature below which internal heat gains from lights, people, and equipment are insufficient to maintain indoor comfort, thus requiring heating.
PASSIVE SOLAR DIRECT GAIN LOW MASS ZONE
Details for passive solar heating in low-mass buildings, including solar radiation requirements and thermal time lag (delay in heat absorption).
PASSIVE SOLAR DIRECT GAIN HIGH MASS ZONE
Same as the Low Mass Zone but for high-mass buildings, which have more thermal inertia and retain heat longer.
WIND PROTECTION OF OUTDOOR SPACES
Indicates the outdoor wind speed at which wind protection becomes desirable and other criteria for maintaining comfort in outdoor areas.
HUMIDIFICATION AND DEHUMIDIFICATION ZONES
Zones are defined by specific humidity levels where adding or removing moisture from the air becomes necessary to maintain comfort.
RADIATION RANGE
The “Radiation Range” chart illustrates the variations in solar radiation throughout the year at the selected location. Here’s an explanation of the key elements of this chart, which are essential for evaluating solar energy potential, designing energy-efficient systems, and optimizing renewable energy applications.
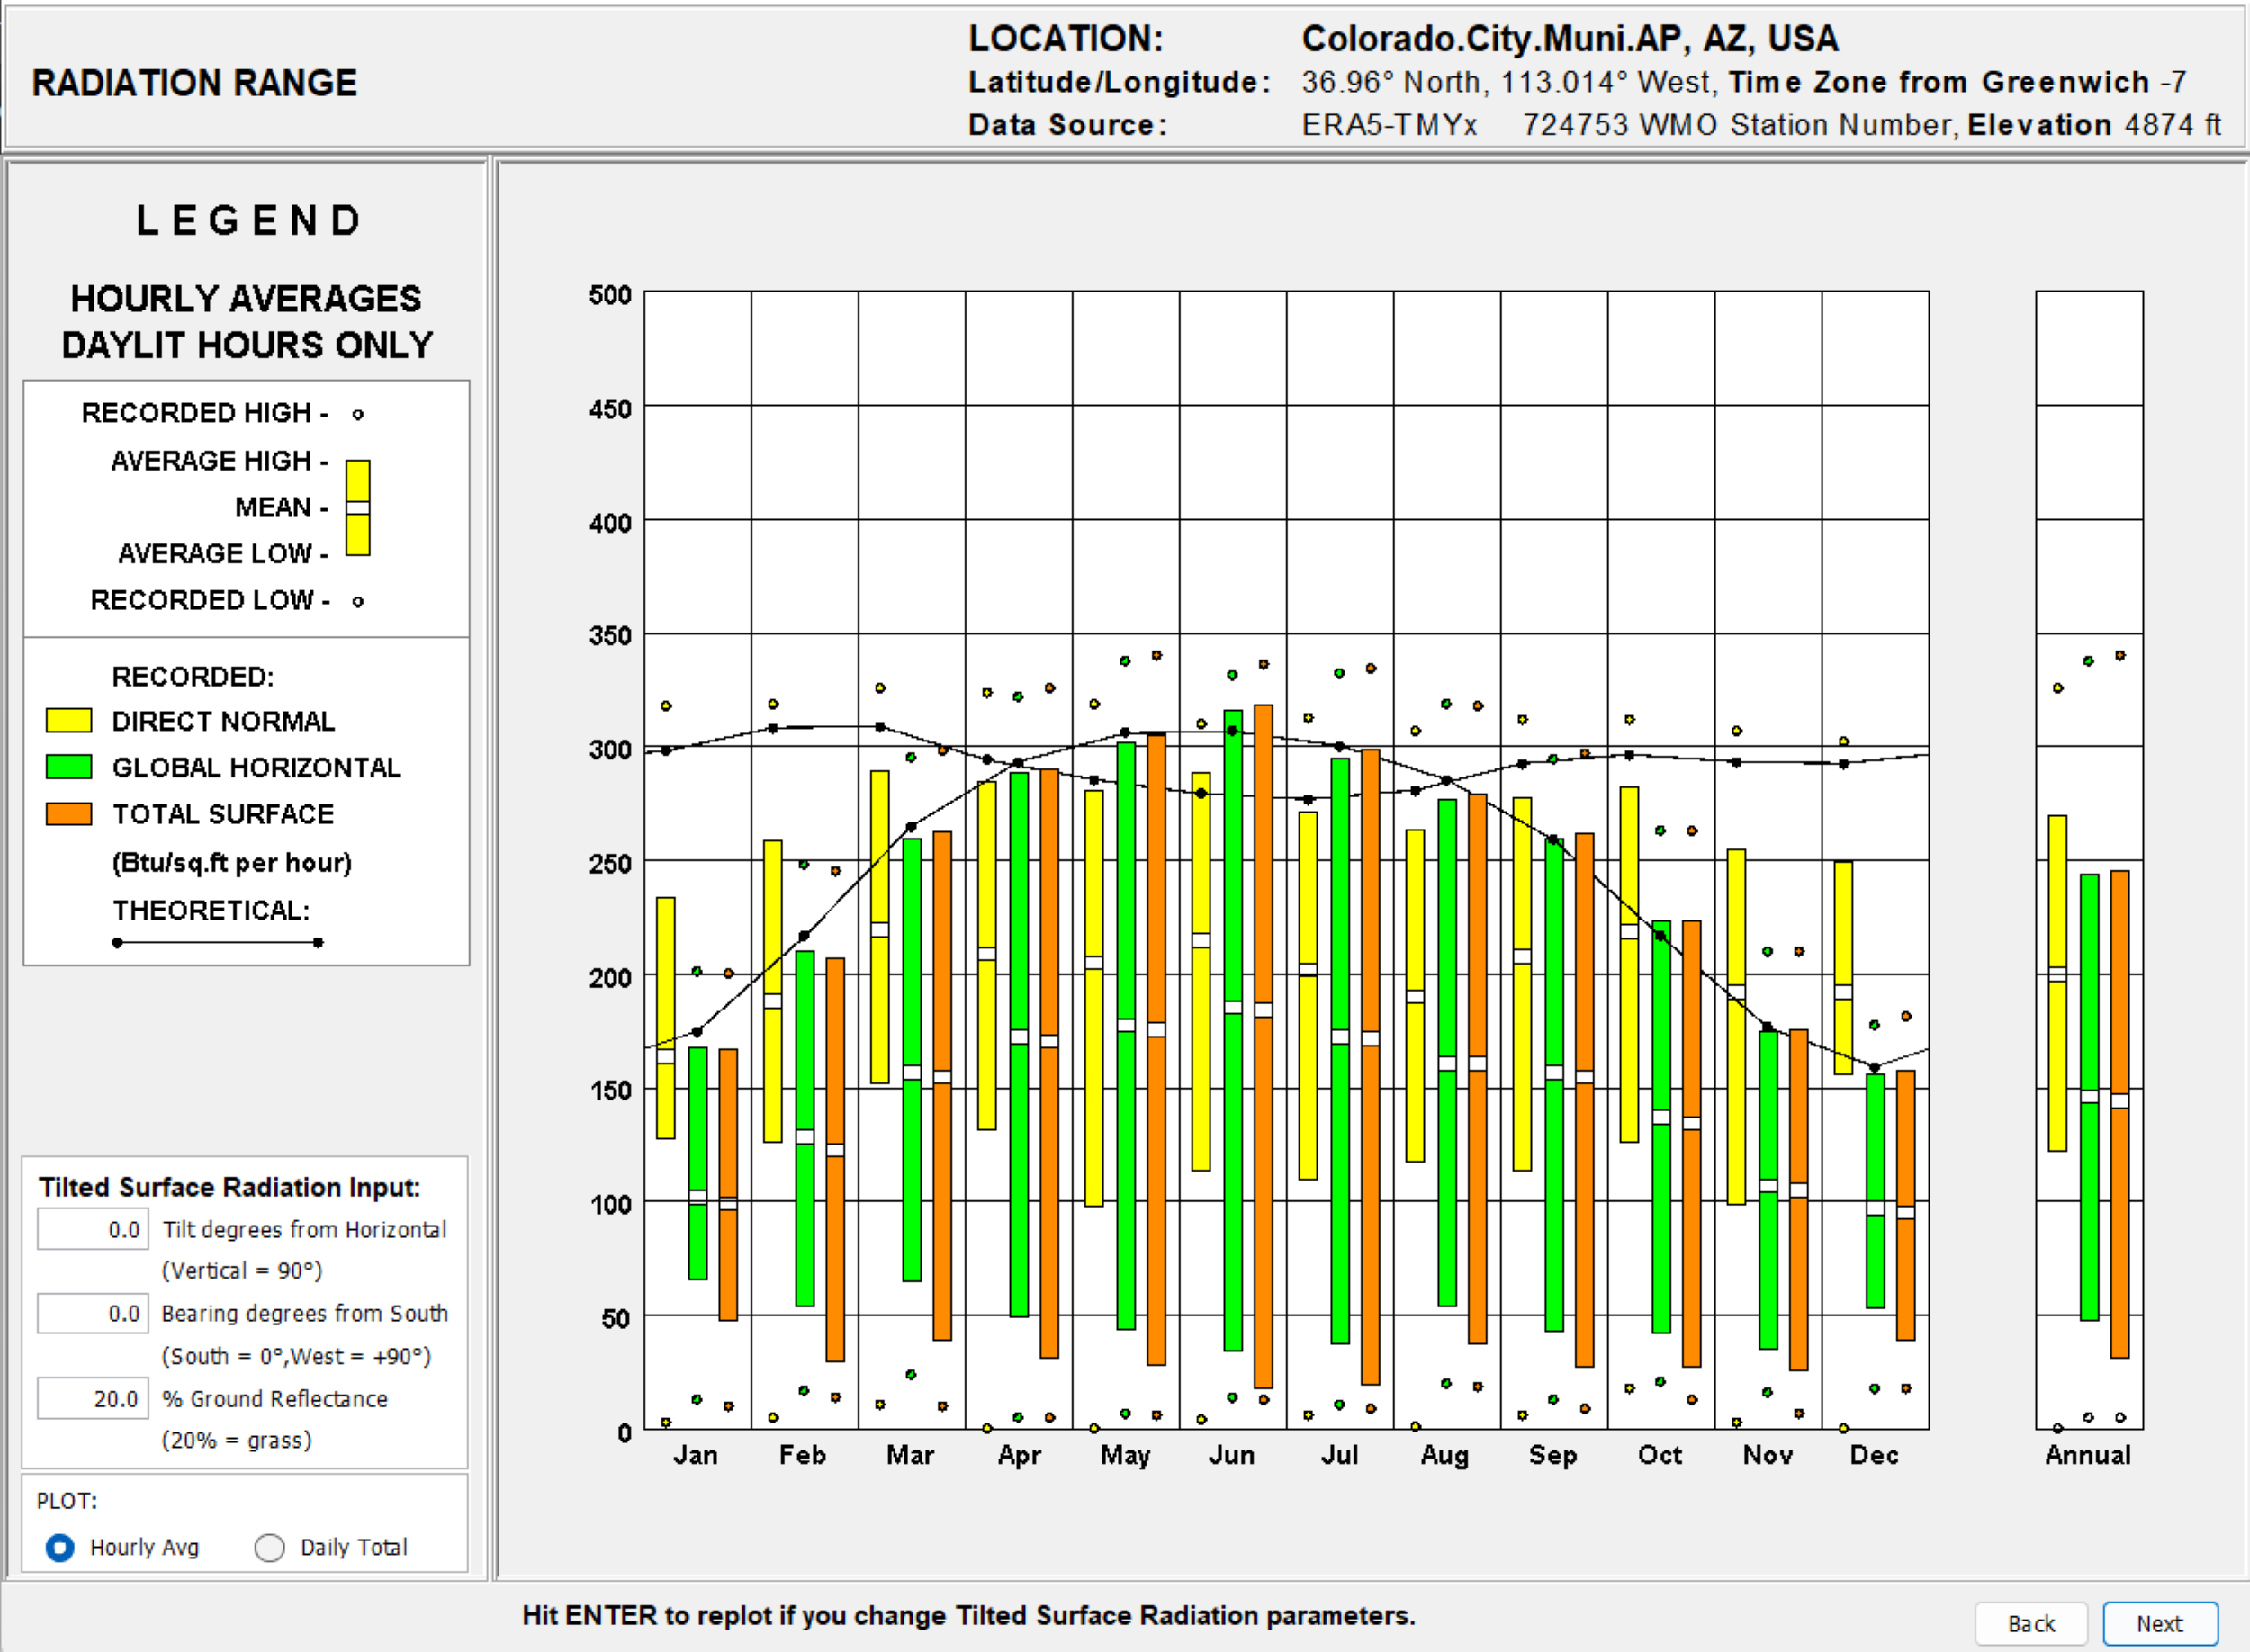
Annual solar radiation range showing global horizontal and direct normal radiation – Click to enlarge
KEY ELEMENTS:
This section breaks down the critical components of the Radiation Range chart and their significance for understanding solar radiation patterns.
RECORDED RADIATION TYPES
Understanding the different types of solar radiation is essential for evaluating solar energy potential, designing energy-efficient buildings, and optimizing renewable energy systems. Solar radiation can be categorized based on how it reaches a surface, whether directly from the sun or after being scattered by the atmosphere. Below, we explore three key types of recorded radiation, each represented by distinct metrics and color-coded for clarity:
- Direct Normal Radiation (Yellow Bars): This measures the amount of solar radiation received per unit area by a surface that is always held perpendicular (normal) to the rays of the sun. It represents the solar energy coming directly from the sun without scattering. High values suggest clear skies and direct sunlight.
- Global Horizontal Radiation (Green Bars): This is the total amount of shortwave radiation received from above by a horizontal surface. It includes both direct solar radiation and diffuse radiation scattered by the atmosphere. This metric is important for understanding overall solar exposure.
- Total Surface Radiation (Orange Bars): This indicates the total amount of radiation received by the tilted surface, including both direct and diffuse radiation components. It helps to evaluate how much solar energy reaches surfaces that are tilted at specific angles, such as roofs or solar panels.
HOURLY AVERAGES (DAYLIGHT HOURS ONLY)
The Radiation Range chart shows hourly averages for each month, during daylight hours only. The bars represent different recorded radiation types, allowing for a comparison across different times of the year.
RECORDED HIGH, AVERAGE HIGH, MEAN, AVERAGE LOW, RECORDED LOW
Analyzing solar radiation data involves understanding both extreme and average values to gain insights into variability and trends over time. This section breaks down the recorded and averaged radiation levels, providing a comprehensive view of monthly solar radiation patterns. These metrics are crucial for assessing solar energy potential, planning energy systems, and understanding seasonal variations in solar exposure. Below are the key components of this analysis:
- Recorded High and Low (Markers): Indicates the highest and lowest recorded values of radiation for each month, shown as black dots on the chart.
- Average High, Mean, and Average Low (Horizontal Lines): These lines represent statistical averages for each month, giving a sense of the typical radiation levels.
TILTED SURFACE RADIATION INPUT
When evaluating solar radiation on tilted surfaces, such as solar panels or sloped roofs, specific parameters like tilt angle, orientation, and ground reflectance play a critical role in determining the total radiation received. These inputs help optimize the positioning of surfaces to maximize solar energy capture. Below are the key parameters used in this analysis:
- Tilt Degrees from Horizontal (Vertical = 90°): The tilt angle of the surface is set at 0 degrees, meaning the data reflects radiation on a horizontal surface.
- Bearing Degrees from South (South = 0°, West = +90°): Bearing is also set at 0 degrees, indicating the surface is oriented towards the south.
- Ground Reflectance (%): Reflectance is set at 20%, which is typical for grassy ground surfaces. This reflects the amount of radiation that bounces back off the ground and is considered in total radiation calculations.
INSIGHTS FOR THE PROJECT
The analysis of solar radiation data provides valuable insights for optimizing the design and functionality of the project, particularly in areas such as energy efficiency, lighting strategies, and indoor plant growth. By understanding monthly radiation patterns and their implications, we can make informed decisions to enhance performance and sustainability. Below are the key insights derived from the data:
- Monthly Radiation Patterns: The above fig data shows that radiation levels around May-July (300-350 Btu/sq.ft per hour) and lowest levels around December-January (150-200 Btu/sq.ft per hour). This information is critical for planning lighting strategies and understanding natural light availability for indoor plant growth.
- Impact on Solar Panel Placement: Since the chart illustrates data for a horizontal surface (0.0° tilt), any potential solar panels or glazing should be adjusted for the optimal angle to maximize solar gain.
- Application to Indoor Plant Growth: The chart informs when additional artificial lighting may be required. For instance, during low radiation months (November to February), more supplemental light might be needed for the plants to ensure sufficient photosynthesis. The chart shows theoretical values (black dots with connecting lines) that help predict expected radiation patterns throughout the year.
EVALUATING ILLUMINATION RANGE
The Illumination Range Chart depicts the hourly averages of natural illumination levels during daylight hours throughout the year. It shows recorded high, low, mean, and average illumination values in footcandles for both direct normal and global horizontal illumination. The chart helps visualize the availability and variation of natural light in the project location over different months.
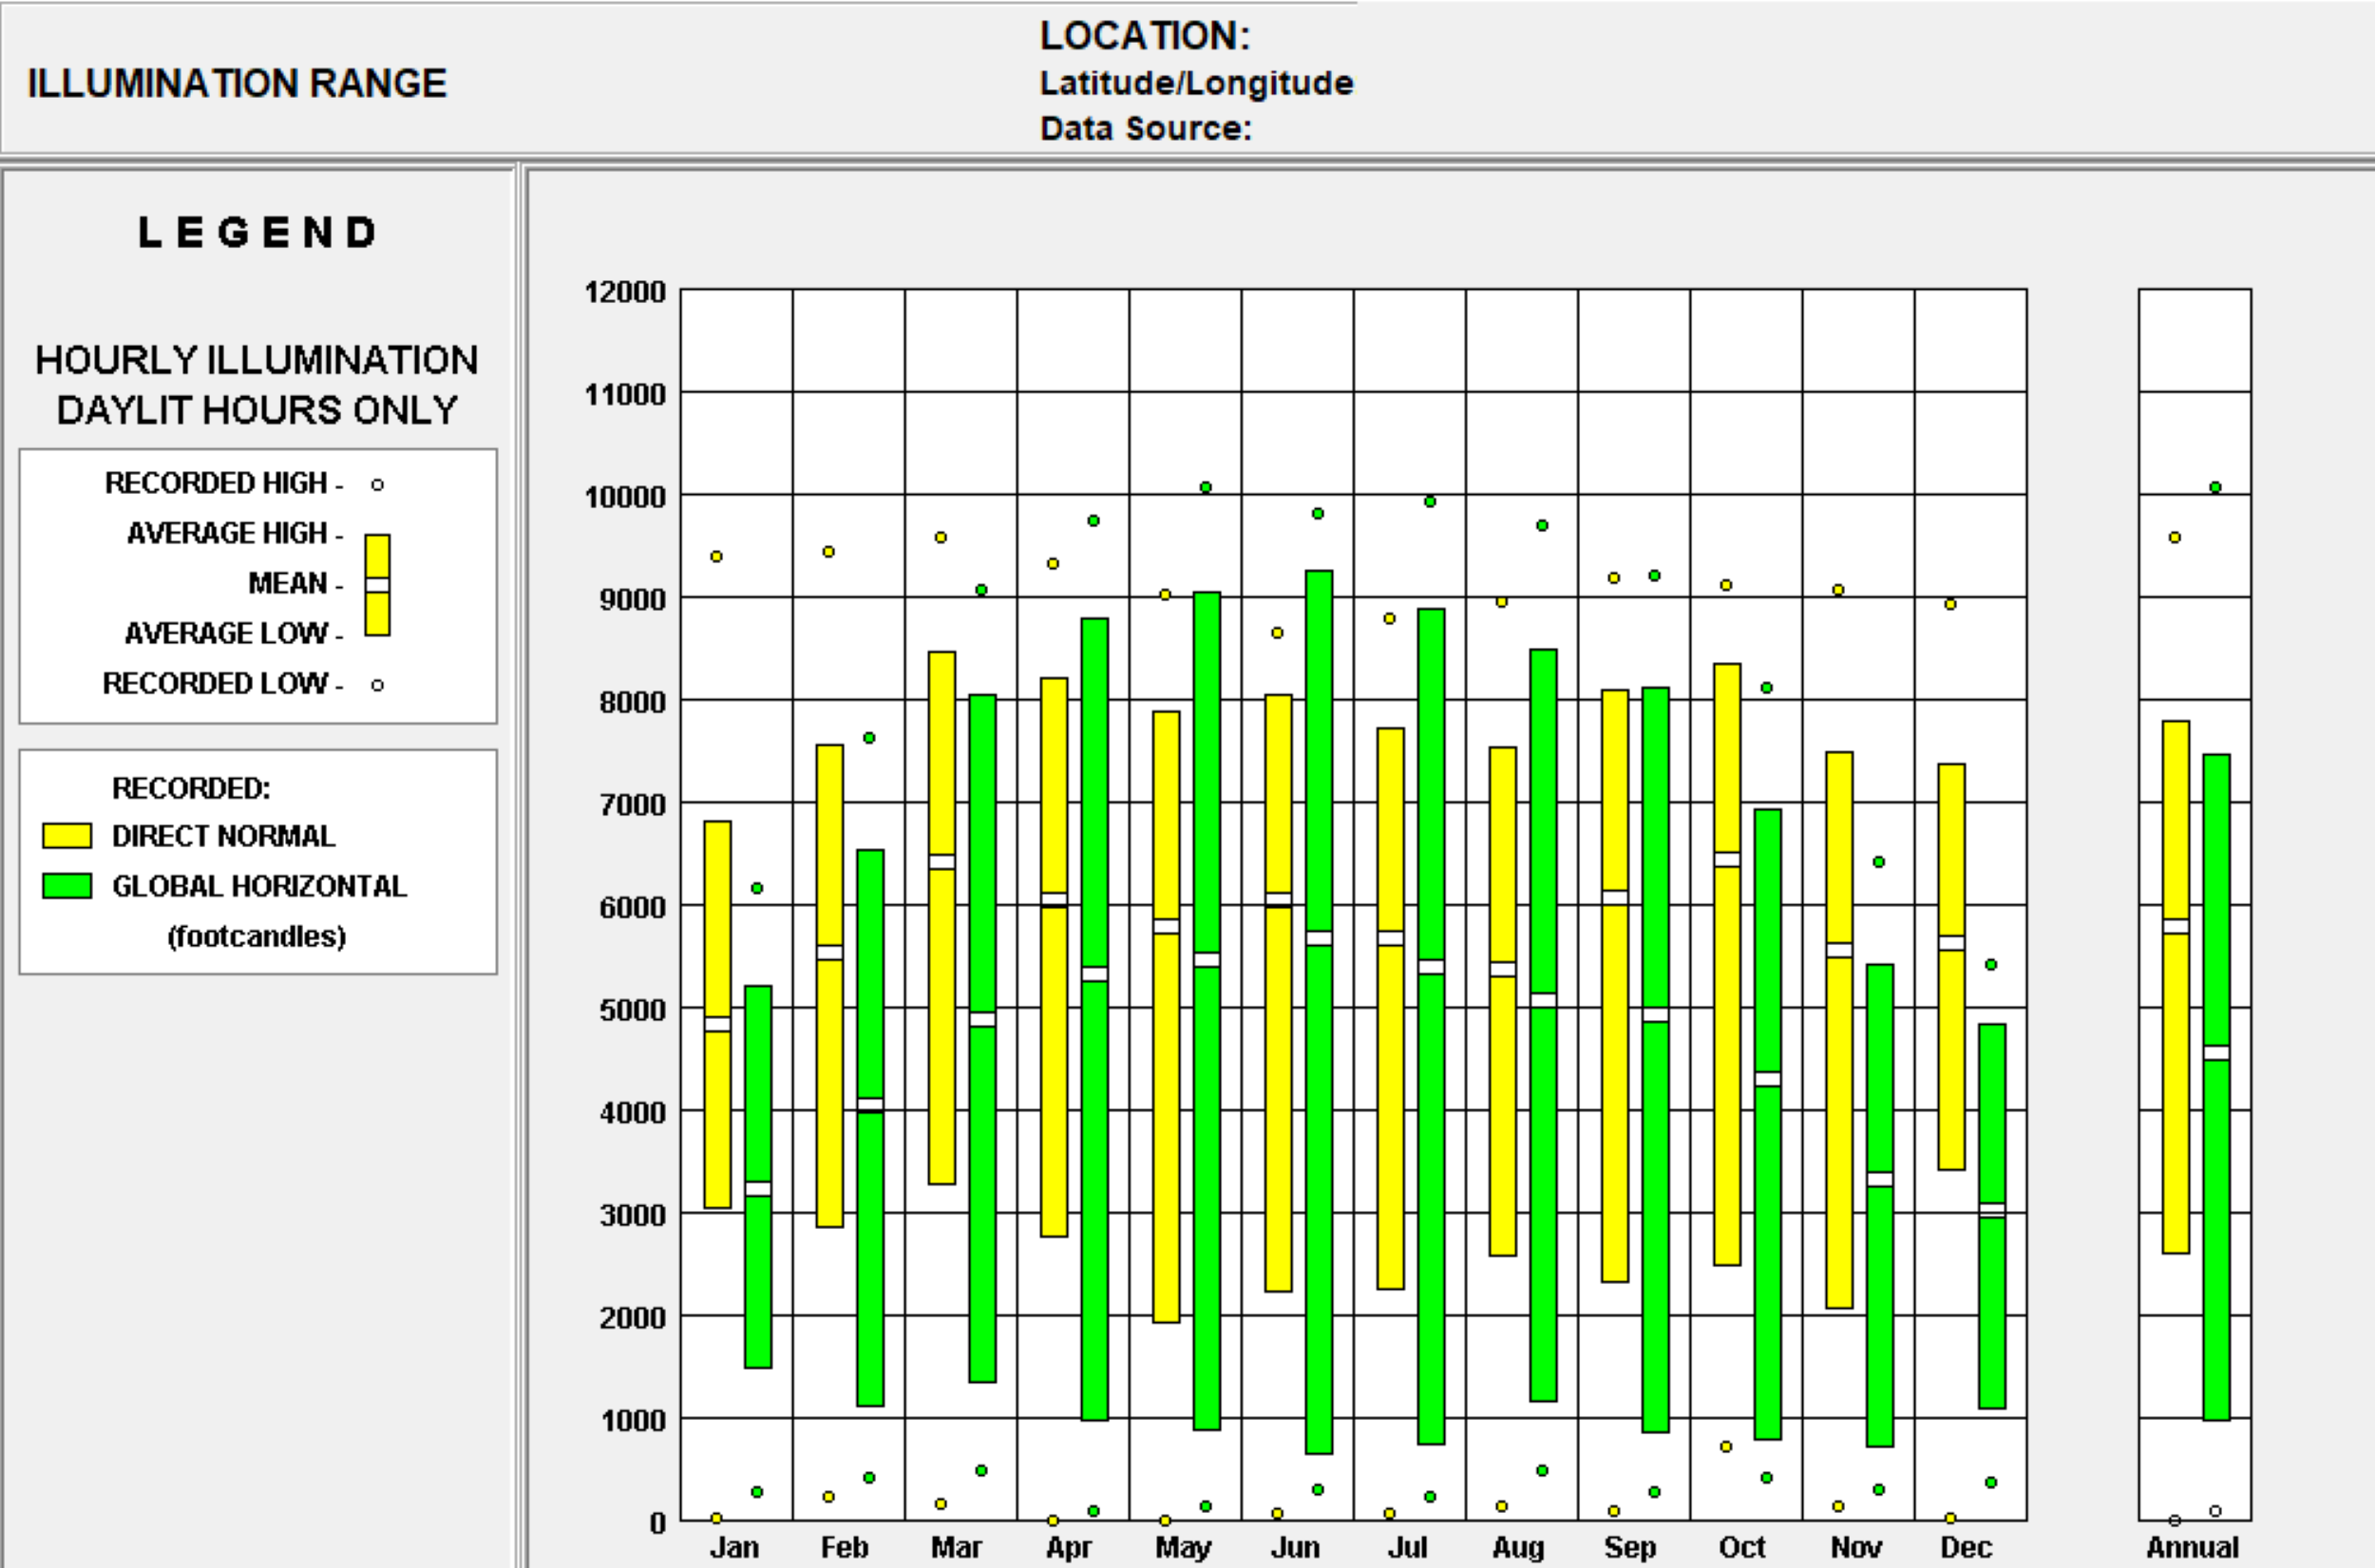
Annual illumination range showing recorded and average light levels – Click to enlarge
UNDERSTANDING THE ILLUMINATION RANGE CHART
Understanding the natural illumination range is crucial for optimizing lighting strategies in the Walipini greenhouse. It allows for precise planning of artificial lighting needs to supplement natural light, ensuring optimal growth conditions for the plant species. By analyzing these illumination levels, energy consumption for artificial lighting can be minimized, aligning with sustainability goals and enhancing plant productivity.
There are several key areas you need to understand to interpret the Illumination Range Chart. We discuss them here.
Y-AXIS (ILLUMINATION IN FOOTCANDLES)
The chart shows illumination levels measured in footcandles (fc) on the Y-axis, ranging from 0 to 12,000 footcandles. The scale allows for detailed analysis of light intensity variations throughout the day and year.
X-AXIS (MONTHS)
The x-axis displays the twelve months of the year, with an additional “Annual” column showing yearly averages. Each month’s data represents:
Recorded Values:
- Recorded High: Black dots showing peak values reaching up to 10,000 footcandles
- Average High: Upper portion of colored bars
- Mean: Middle section of colored bars
- Average Low: Lower portion of colored bars
- Recorded Low: Black dots at bottom, showing minimum values
Illumination Types:
- Direct Normal Illumination (Yellow Bars): Measures light received perpendicular to sun rays
- Global Horizontal Illumination (Green Bars): Represents total illumination received by a horizontal surface, including both direct and diffuse light
Note – Project Site Considerations:
Due to the higher elevation of the project site, actual illumination levels may differ from the recorded data:
- Clearer atmosphere at 6000 ft will result in higher direct normal illumination
- Reduced atmospheric scattering may affect global horizontal illumination
- Higher UV light penetration should be considered in plant lighting strategies
- More intense light during peak hours due to thinner atmosphere
These elevation-related factors must be considered when planning supplemental lighting strategies for the greenhouses.
KEY INSIGHTS FROM THE CHART
The Illumination Range Chart provides essential data on the variations in natural light availability throughout the year, serving as a critical tool for planning and optimizing the lighting strategy within the greenhouses. By analyzing these illumination levels, we can effectively balance natural and artificial lighting to ensure that the plants receive the required light intensity for healthy growth. This chart helps identify periods of adequate natural light and times when additional artificial lighting will be necessary to maintain optimal growing conditions.
SEASONAL VARIATIONS IN ILLUMINATION
Understanding seasonal variations in illumination is crucial for designing effective lighting strategies, particularly for projects that rely on natural light or require consistent lighting conditions. The data reveals clear patterns in illumination levels throughout the year, which can inform decisions about supplemental lighting and energy use. Below are the key observations and their implications:
Illumination levels show significant seasonal patterns:
- Summer months (May-August): Direct normal illumination reaches 8000-9000 footcandles
- Winter months (November-February): Values drop to 5000-7000 footcandles
- Spring/Fall: Show transitional values with greater daily variations
These variations must be considered when planning supplemental lighting schedules
PEAK ILLUMINATION PERIODS
Peak illumination periods represent times of the year when natural light availability is at its highest, providing an opportunity to maximize the use of daylight and reduce reliance on artificial lighting. However, even during these periods, certain times of the day may still require supplemental lighting to maintain consistent illumination levels. Below are the key characteristics of peak illumination periods and their implications:
- Highest readings occur May through July
- Direct normal illumination peaks at approximately 9000-10000 footcandles
- Global horizontal illumination shows maximum values around 9000 footcandles
- Morning and evening hours require supplemental lighting even during peak periods
LOW ILLUMINATION PERIODS
Low illumination periods, typically occurring during the winter months, present challenges for maintaining adequate light levels in indoor environments. These periods are characterized by significantly reduced natural light availability, necessitating careful planning and implementation of supplemental lighting strategies. Below are the key characteristics of low illumination periods and their implications:
- December and January show lowest illumination levels
- Direct normal illumination drops to approximately 5000-6000 footcandles
- Global horizontal illumination reduces to 3000-4000 footcandles
- These periods require maximum supplemental lighting
DIRECT NORMAL VS. GLOBAL HORIZONTAL RADIATION
Understanding the differences between direct normal and global horizontal radiation is essential for evaluating solar energy potential and designing effective daylighting strategies. These two types of radiation represent distinct components of solar energy, each with unique characteristics and implications for project planning. Below are the key insights into their differences and the influence of the project site’s elevation:
- Direct normal illumination (yellow bars) shows higher peaks but greater variability
- Global horizontal illumination (green bars) demonstrates more consistent but lower values
- The difference indicates significant scattered light contribution
- Project site’s higher elevation will affect both direct and scattered light components
Note – PROJECT SITE CONSIDERATIONS:
- Due to the elevation difference, actual illumination levels at the project site will likely show:
- Higher direct normal illumination due to less atmospheric interference
- Clearer atmospheric conditions affecting light scattering
- Increased UV radiation intensity
- More consistent daily patterns due to reduced atmospheric variables
- Potentially stronger peak illumination values
These elevation-related factors must be integrated into the supplemental lighting strategy for greenhouse to ensure optimal growing conditions throughout the year.
APPLICATION TO GREENHOUSE
The illumination data gathered provides critical insights into optimizing the lighting strategy for greenhouses by addressing the unique needs of different plant zones. By aligning artificial lighting with the natural light patterns observed throughout the year, we can ensure that each zone receives the appropriate light intensity required for healthy plant growth. This approach not only supports optimal plant development but also enhances energy efficiency by minimizing the reliance on artificial lighting during periods of high natural illumination.
HIGH-INTENSITY LIGHT ZONES
For plants requiring high light intensity, understanding the availability of natural light throughout the year is critical for optimizing growth conditions and minimizing energy use for supplemental lighting. The project site’s elevation further influences light intensity and quality, adding another layer of complexity to planning. Below are the key considerations for high-intensity light zones:
- December-January: Maximum supplemental lighting needed when direct normal illumination drops to 5000-6000 footcandles
- May-July: Minimum supplemental lighting needed during peak illumination of 8000-9000 footcandles
- Morning/Evening: Year-round supplementation required during lower light periods
Note – Consider higher elevation effects:
- Increased UV radiation
- Greater light intensity during clear days
- Less atmospheric interference
MODERATE LIGHT ZONES
For plants with moderate light requirements, balancing natural light availability with supplemental lighting is key to maintaining optimal growth conditions while conserving energy. By leveraging natural light during peak hours and implementing smart, automated systems, the project can ensure consistent illumination tailored to the needs of these plants. Below are the key strategies and considerations for moderate light zones:
- April-September: Natural light sufficient during peak hours (10 AM – 4 PM)
- October-March: Increased supplemental lighting needed
Implement automated systems:
- Light sensors to monitor real-time illumination levels
- Dimmable LED fixtures for dynamic adjustment
- Zone-specific controls based on plant requirements
STRATEGIC LIGHTING PLACEMENT
Effective lighting placement is essential for maximizing natural light utilization, minimizing energy consumption, and ensuring optimal growing conditions for plants. By carefully considering natural light patterns, structural shading, seasonal sun angles, and the unique effects of higher elevation, the project can design a lighting system that is both efficient and responsive to environmental conditions. Below are the key considerations for strategic lighting placement:
- Orient fixtures to complement natural light patterns
- Account for structural shading effects
- Consider seasonal sun angles
Note: Adjust for higher elevation effects:
- Clearer atmosphere
- More intense direct sunlight
- Different light scattering patterns
- Increased UV penetration
ELEVATION ADJUSTMENTS
The project site’s higher elevation introduces unique environmental conditions that significantly influence lighting strategies. These conditions include clearer atmospheric conditions, increased UV intensity, and altered light distribution patterns. To optimize plant growth and energy efficiency, specific adjustments must be made to account for these factors. Below are the key strategies for elevation adjustments:
- Reduced supplemental lighting during clear days
- Increased protection from UV intensity
- Modified light distribution patterns
- Adjusted timing of artificial lighting based on clearer atmospheric conditions
- Enhanced monitoring of plant response to higher natural light intensity.
These strategies should be fine-tuned based on actual plant response and regular monitoring of light levels at the specific project location.
RECOMMENDATIONS
To optimize the lighting strategy and energy usage for Walipini 1, it is essential to integrate systems and technologies that respond to natural light variations throughout the year. Implementing these recommendations will enhance energy efficiency, reduce operational costs, and provide optimal growth conditions for the plants by dynamically adjusting artificial lighting based on real-time data and seasonal requirements.
INSTALL SMART LIGHTING CONTROLS
To optimize lighting efficiency and ensure ideal growing conditions for plants, the installation of smart lighting controls is essential. These systems leverage real-time data and automation to dynamically adjust lighting based on environmental conditions, plant needs, and elevation-specific factors. Below are the key components and strategies for implementing smart lighting controls:
- Implement photosensors to monitor real-time illumination levels
- Account for elevation-enhanced natural light intensity
- Install UV sensors to monitor increased radiation at higher altitude
- Create zone-specific monitoring systems based on plant requirements
- Integrate weather monitoring to anticipate cloud cover impacts
UTILIZE ADAPTIVE LED TECHNOLOGY: DIMMABLE LEDS
Adaptive LED technology, particularly dimmable LED fixtures, offers a versatile and energy-efficient solution for meeting the diverse lighting needs of plants. By integrating full-spectrum capabilities, UV-filtering options, and dynamic control systems, the project can create a lighting environment that adapts to natural light availability, elevation-specific conditions, and the unique requirements of different plant zones. Below are the key strategies for utilizing adaptive LED technology:
- Install dimmable LED fixtures with full-spectrum capability
- Program automatic adjustment based on natural light availability
- Incorporate UV-filtering options for high-intensity periods
- Create separate control zones for different plant requirements
- Enable dynamic spectrum adjustment throughout the day
IMPLEMENT SEASONAL STRATEGIES
To ensure optimal lighting conditions year-round, it is essential to adopt seasonal strategies that account for variations in natural light availability, elevation-specific factors, and plant requirements. By tailoring lighting approaches to the unique characteristics of each season, the project can maintain consistent plant growth while optimizing energy use. Below are the key strategies for each season:
Winter (November-February):
- Increase supplemental lighting during 5000-6000 footcandle periods
- Extended morning and evening light supplementation
- Adjust for clearer atmospheric conditions at higher elevation
Summer (May-August):
- Reduce artificial lighting during 8000-9000 footcandle periods
- Focus on early morning and late evening supplementation
- Consider UV protection during peak hours
Spring & Fall:
- Dynamic adjustment based on transitional light patterns
- Balance natural and artificial light during variable conditions
- Monitor plant responses during changing light conditions
CONCLUSION
The Illumination Range data (Fig 3) adjusted for the project site’s higher elevation, provides the foundation for an energy-efficient lighting strategy in Greenhouses. The recommendations focus on creating a responsive system that optimizes natural light utilization while ensuring consistent growing conditions throughout the year. Regular monitoring and adjustment of these systems will be crucial for maintaining optimal plant growth conditions while maximizing energy efficiency.
EVALUATING SKY COVER RANGE
The Sky Cover Range chart provides a comprehensive view of the cloud cover patterns over the project location throughout the year. It indicates the frequency and extent of cloud cover, which directly impacts the availability of natural sunlight for the greenhouse. This data is crucial for planning the integration of artificial lighting, as it helps identify periods when cloud cover may reduce sunlight penetration, necessitating additional lighting to support plant growth. Understanding sky cover variations allows for better energy management and optimization of lighting strategies in Greenhouse.
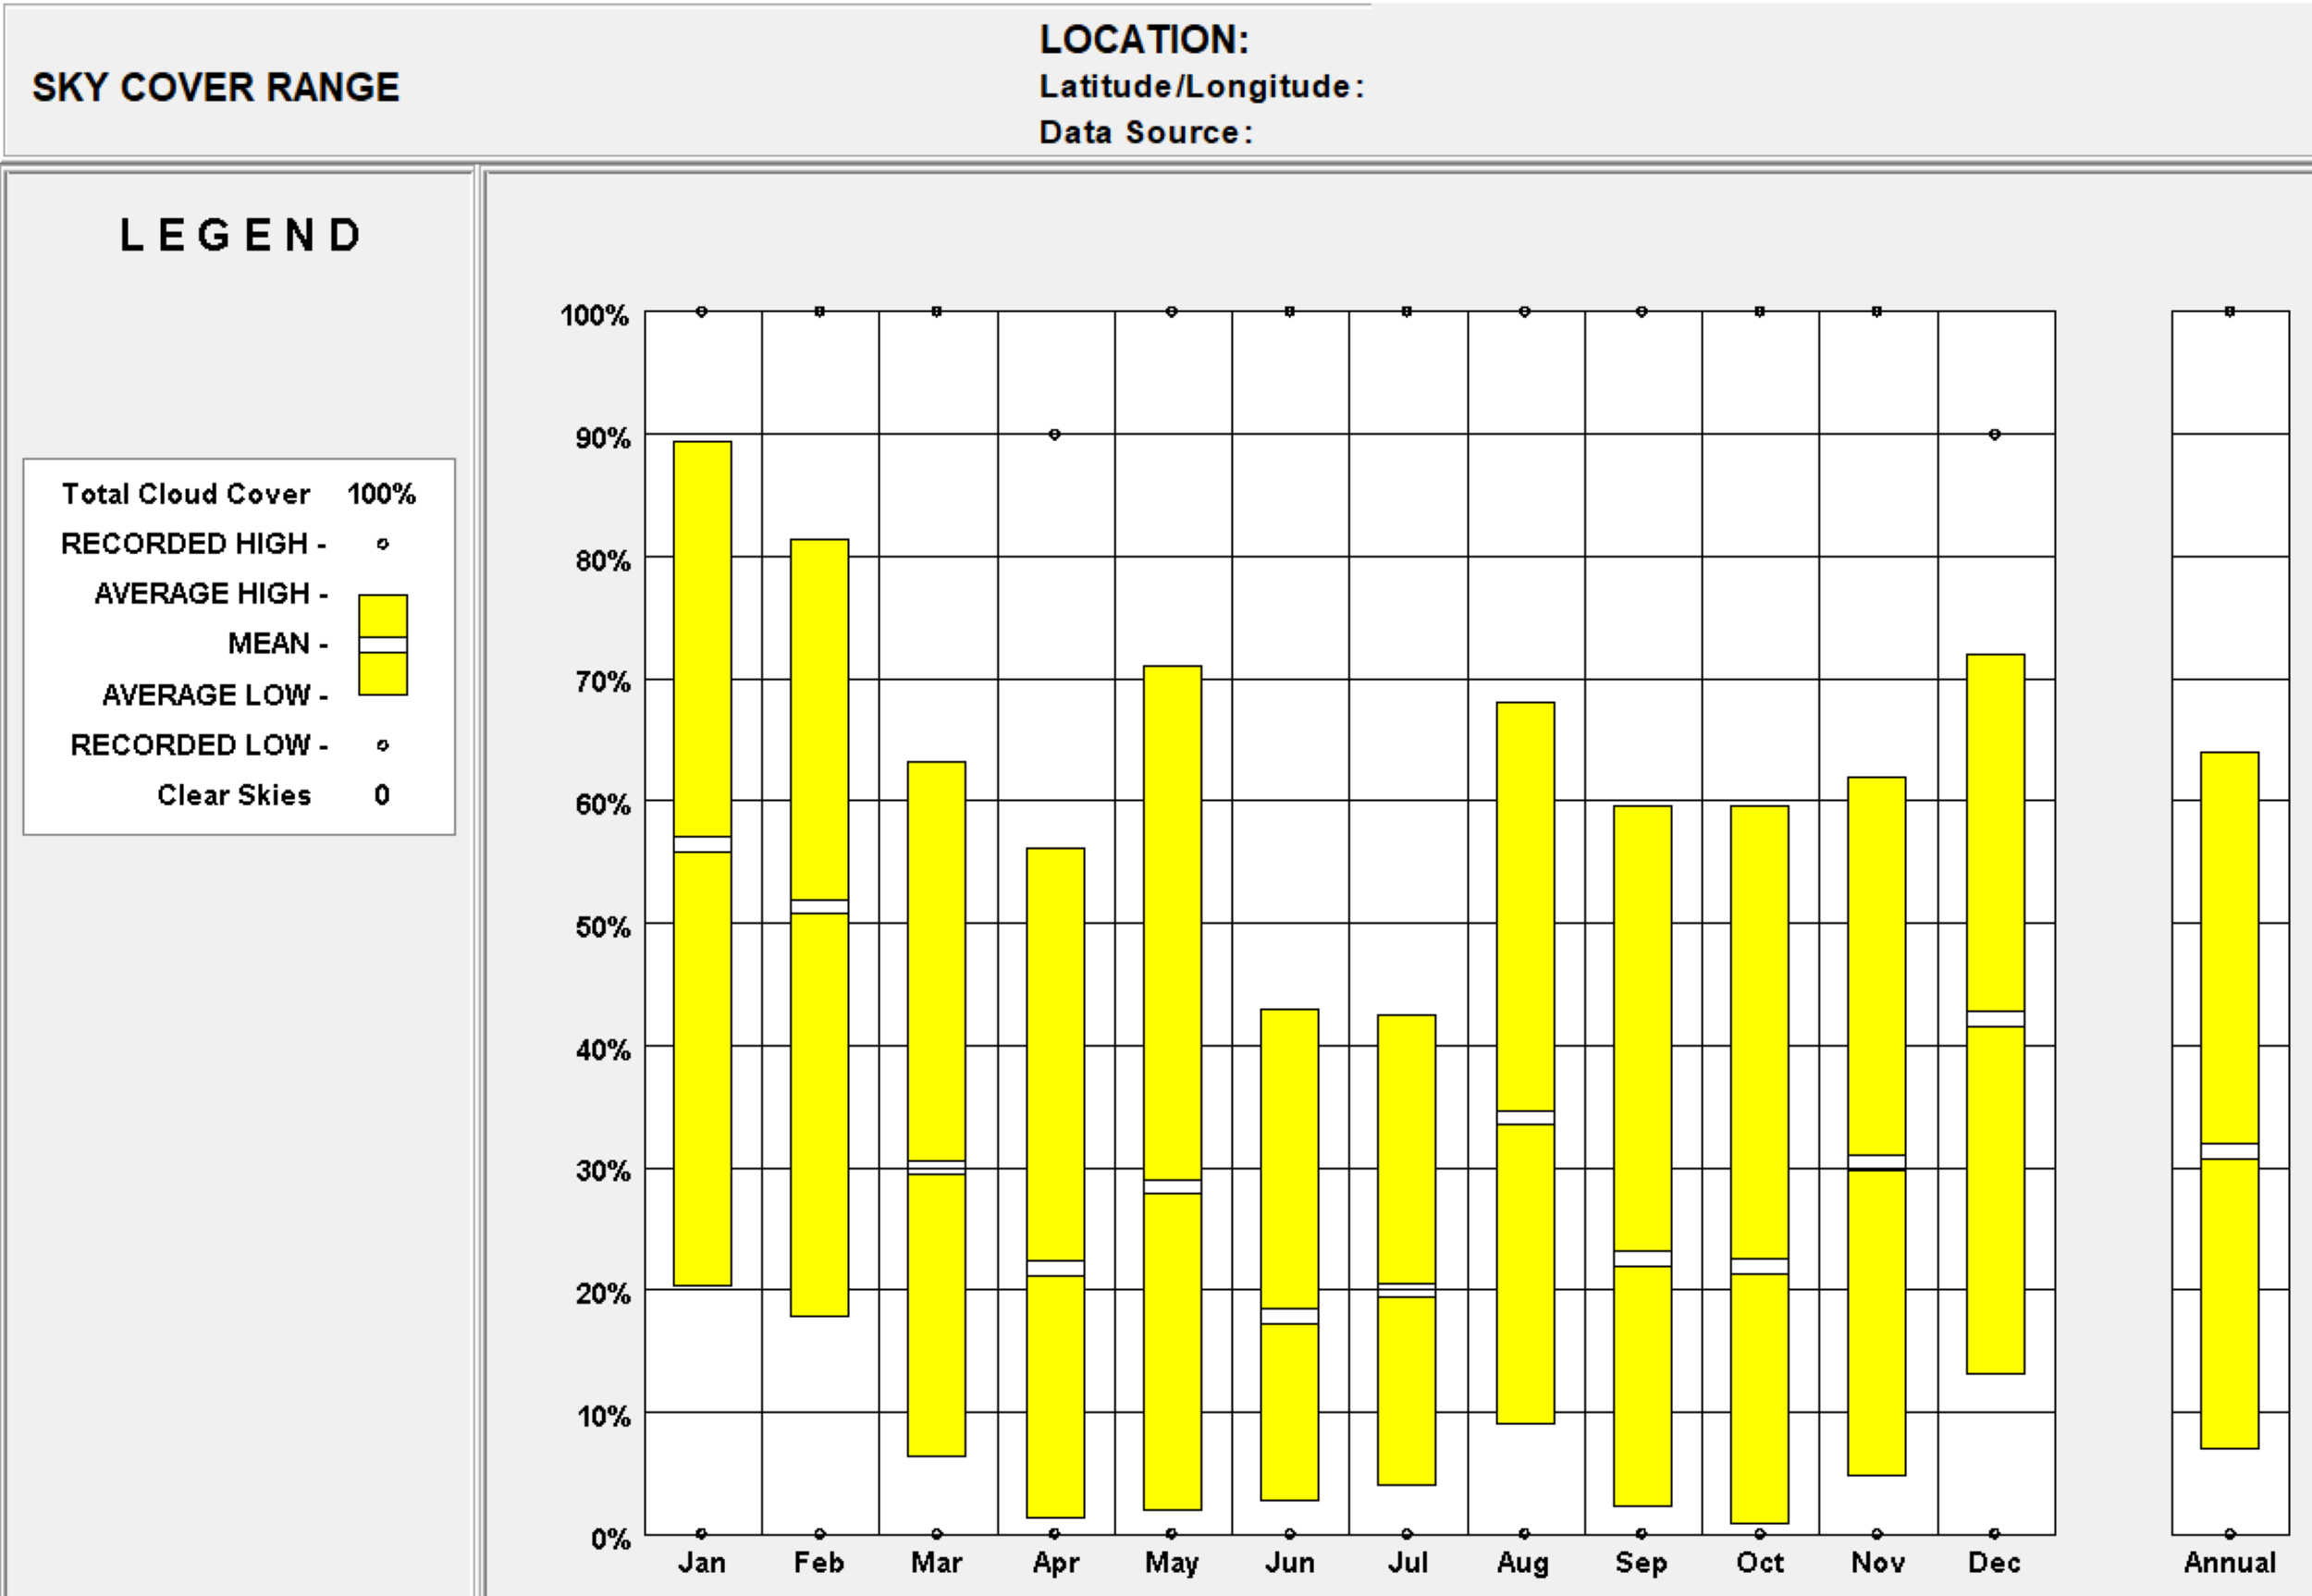
Annual sky cover range showing total cloud cover and clear sky percentages – Click to enlarge
UNDERSTANDING THE SKY COVER RANGE CHART
The chart is divided into key components that provide a detailed analysis of cloud cover patterns:
Y-AXIS (TOTAL CLOUD COVER IN PERCENTAGE)
The Y-axis represents the total cloud cover on a scale from 0-100%, indicating how much of the sky is covered by clouds during daylight hours. Yellow bars show the percentage of cloud cover, with black dots marking the recorded high and low values, and horizontal lines within the bars representing mean values.
X-AXIS (MONTHS)
The X-axis shows the months of the year, illustrating how cloud cover changes over time. It includes a monthly distribution throughout the year, with the annual average displayed in the rightmost column for comprehensive comparison. Data is collected during daylight hours only to ensure consistency and relevance to daily conditions.
RECORDED VALUES IN SKY COVER RANGE
The recorded values in the sky cover range provide a detailed analysis of cloud cover variations throughout the year:
- Recorded High: Represented by black dots (○) at the top of the chart, these values indicate maximum cloud cover, often reaching 100%.
- Average High: Shown as the upper portion of the yellow bars, average high cloud cover ranges from approximately 70-90% during winter to around 40-45% in summer.
- Mean: Indicated by a horizontal line within the yellow bars, the mean cloud cover hovers around 50-60% during winter months and drops to 20-30% in summer.
- Average Low: The lower portion of the yellow bars reflects minimum cloud cover, showing values as low as ~20% in winter and ~5% in summer.
- Recorded Low: Represented by black dots (○) at the bottom of the chart, recorded low values highlight periods of clear skies, reaching 0% cloud cover.
Note: Due to the project site’s higher elevation, actual cloud cover patterns may show:
- Generally clearer conditions
- Lower average cloud cover
- More frequent clear sky periods
KEY INSIGHTS FROM THE CHART
Analyzing the Sky Cover Range chart enables a deeper understanding of how varying cloud cover influences the distribution of natural light within the greenhouse. It illustrates the monthly trends of sky clarity and overcast conditions, providing essential context for forecasting potential light shortages during heavily clouded periods. This information is key for developing a responsive lighting plan that adjusts the intensity and duration of artificial lighting based on seasonal cloud cover fluctuations, ensuring that energy consumption remains efficient and plant health is maintained year-round.
SEASONAL CLOUD COVER VARIATION
The Seasonal Cloud Cover Variation section highlights the significant fluctuations in cloud cover throughout the year, as depicted in the Sky Cover Range chart. These variations play a critical role in determining the availability of natural light for the greenhouse, influencing both plant growth and energy management strategies. By understanding these patterns, the project can better anticipate periods of reduced sunlight and plan for supplemental lighting needs accordingly. Below are the key observations:
- The chart shows a significant variation in cloud cover throughout the year. Higher cloud cover is generally observed in the winter months (December to February), with January showing the highest at approximately 90% and February at 80%.
- Lower cloud cover is seen in the summer months (June to August), with values dropping to approximately 40-45% maximum coverage.
IMPACT ON NATURAL LIGHTING
The Impact on Natural Lighting section examines how seasonal cloud cover variations influence the availability of natural light within the greenhouse. These fluctuations directly affect the need for supplemental lighting, particularly during periods of high cloud cover when sunlight penetration is significantly reduced. By understanding these impacts, the project can develop targeted strategies to ensure consistent light levels for plant growth while optimizing energy use. Below are the key insights:
- High Cloud Cover Periods (Winter Months): With cloud cover reaching 90% in January and 80% in February, less natural light will penetrate the greenhouse. This period will require increased artificial lighting to maintain optimal growing conditions for plants, particularly those in high-intensity light zones.
- Low Cloud Cover Periods (Summer Months): During June through August, cloud cover drops to 40-45% maximum, indicating more abundant natural sunlight. Artificial lighting requirements can be reduced in these months, saving energy.
IMPLICATIONS FOR ENERGY MANAGEMENT
The Implications for Energy Management section explores how seasonal cloud cover variations influence energy consumption and planning for artificial lighting in the greenhouse. By aligning energy strategies with cloud cover patterns, the project can optimize energy use, reduce costs, and maintain efficient operations throughout the year. Below are the key considerations:
- The seasonal cloud cover variations should inform energy planning for artificial lighting. Energy consumption is likely to increase during high cloud cover months (December-February) due to the greater need for supplemental light.
- Energy-saving measures, such as light sensors and dimmable LEDs, should be calibrated to take advantage of periods with lower cloud cover (June-August), reducing the reliance on artificial light when natural light is sufficient.
APPLICATION TO GREENHOUSE
This section explains how the Sky Cover Range data can be applied to optimize artificial lighting strategies for the greenhouse.
- Effective utilization of the Sky Cover Range data is essential for tailoring the artificial lighting strategy to the specific needs of Greenhouse.
- By understanding that cloud cover varies from 90% in January to 40-45% in summer months, lighting systems can be designed to dynamically respond to these changes in cloud cover and sunlight penetration.
- This approach ensures that plants receive consistent light levels regardless of external weather conditions, promoting optimal growth while maintaining energy efficiency.
ARTIFICIAL LIGHTING ADJUSTMENTS
This highlights the need for adjustable lighting systems based on seasonal cloud cover variations.
- The data shows cloud cover reaching 90% in January and 80% in February, requiring maximum artificial lighting during these winter months.
- Summer months (June-August) show only 40-45% maximum cloud cover, allowing for reduced artificial lighting.
- This variation suggests the need for adjustable artificial lighting systems that can respond dynamically to these seasonal changes in natural light availability.
STRATEGIC LIGHT PLACEMENT
This emphasizes the importance of positioning artificial lights to maximize coverage during periods of high cloud cover.
- Based on the chart data showing highest cloud cover (70-90%) during December through February, artificial lights should be positioned to provide maximum coverage during these months.
- This will help ensure consistent light distribution even when natural light is limited by the significant winter cloud cover.
Note – The project site may experience clearer conditions due to the elevation difference compared to the weather station
RECOMMENDATIONS
To effectively manage the balance between natural and artificial lighting in Greenhouse, it is crucial to implement strategies that respond to the dynamic environmental conditions throughout the year. By integrating technology and planning for seasonal variations, the lighting system can be optimized for energy efficiency, cost savings, and ideal plant growth conditions. The following recommendations provide a framework for achieving these goals.
IMPLEMENT LIGHT SENSORS
This highlights the importance of real-time monitoring and adaptive lighting systems.
- Install light sensors to monitor real-time light levels, particularly during winter months when cloud cover reaches 90% in January and 80% in February.
- Adjust artificial lighting accordingly to maintain consistent light levels for plant growth throughout the year.
USE DIMMABLE LED FIXTURES
This emphasizes the benefits of adjustable lighting systems for energy efficiency.
- Utilize dimmable LED fixtures to modulate light intensity based on actual cloud cover conditions, which range from 90% maximum in January to 40-45% during summer months (June-August),
- Maximizing energy savings during periods of low cloud cover by reducing artificial light intensity when natural light is sufficient.
PLAN FOR SEASONAL VARIATIONS:
This outlines the need for a seasonal lighting strategy to address varying cloud cover conditions.
- Develop a seasonal lighting schedule that accounts for the significant variation in cloud cover.
- Increase artificial light during high cloud cover months (December to February, 70-90% coverage) and decrease it during low cloud cover months (June to August, 40-45% coverage).
CONCLUSION
The Sky Cover Range data is essential for optimizing the balance between natural and artificial lighting in Greenhouse. With cloud cover varying significantly from 90% in January to 40-45% in summer months, this information enables precise planning of supplemental lighting needs throughout the year. Understanding these patterns ensures both cost efficiency and sustainability while maintaining ideal growing conditions year-round.
Note – The project site may experience clearer conditions due to the elevation difference compared with the data shown from the weather station.
GROUND TEMPERATURE ANALYSIS AND APPLICATION
Understanding ground temperature dynamics is essential for optimizing the thermal performance of Greenhouse. The stable temperatures found at greater soil depths can be utilized to naturally regulate the internal climate of the greenhouse, reducing reliance on external heating and cooling systems. By incorporating strategies such as thermal mass utilization, geothermal heating, and targeted foundation insulation, the greenhouse can maintain a more consistent internal environment, promoting plant health and energy efficiency. This analysis also supports the design of specialized systems to manage root zone temperatures for sensitive crops, ensuring optimal growing conditions throughout the year.
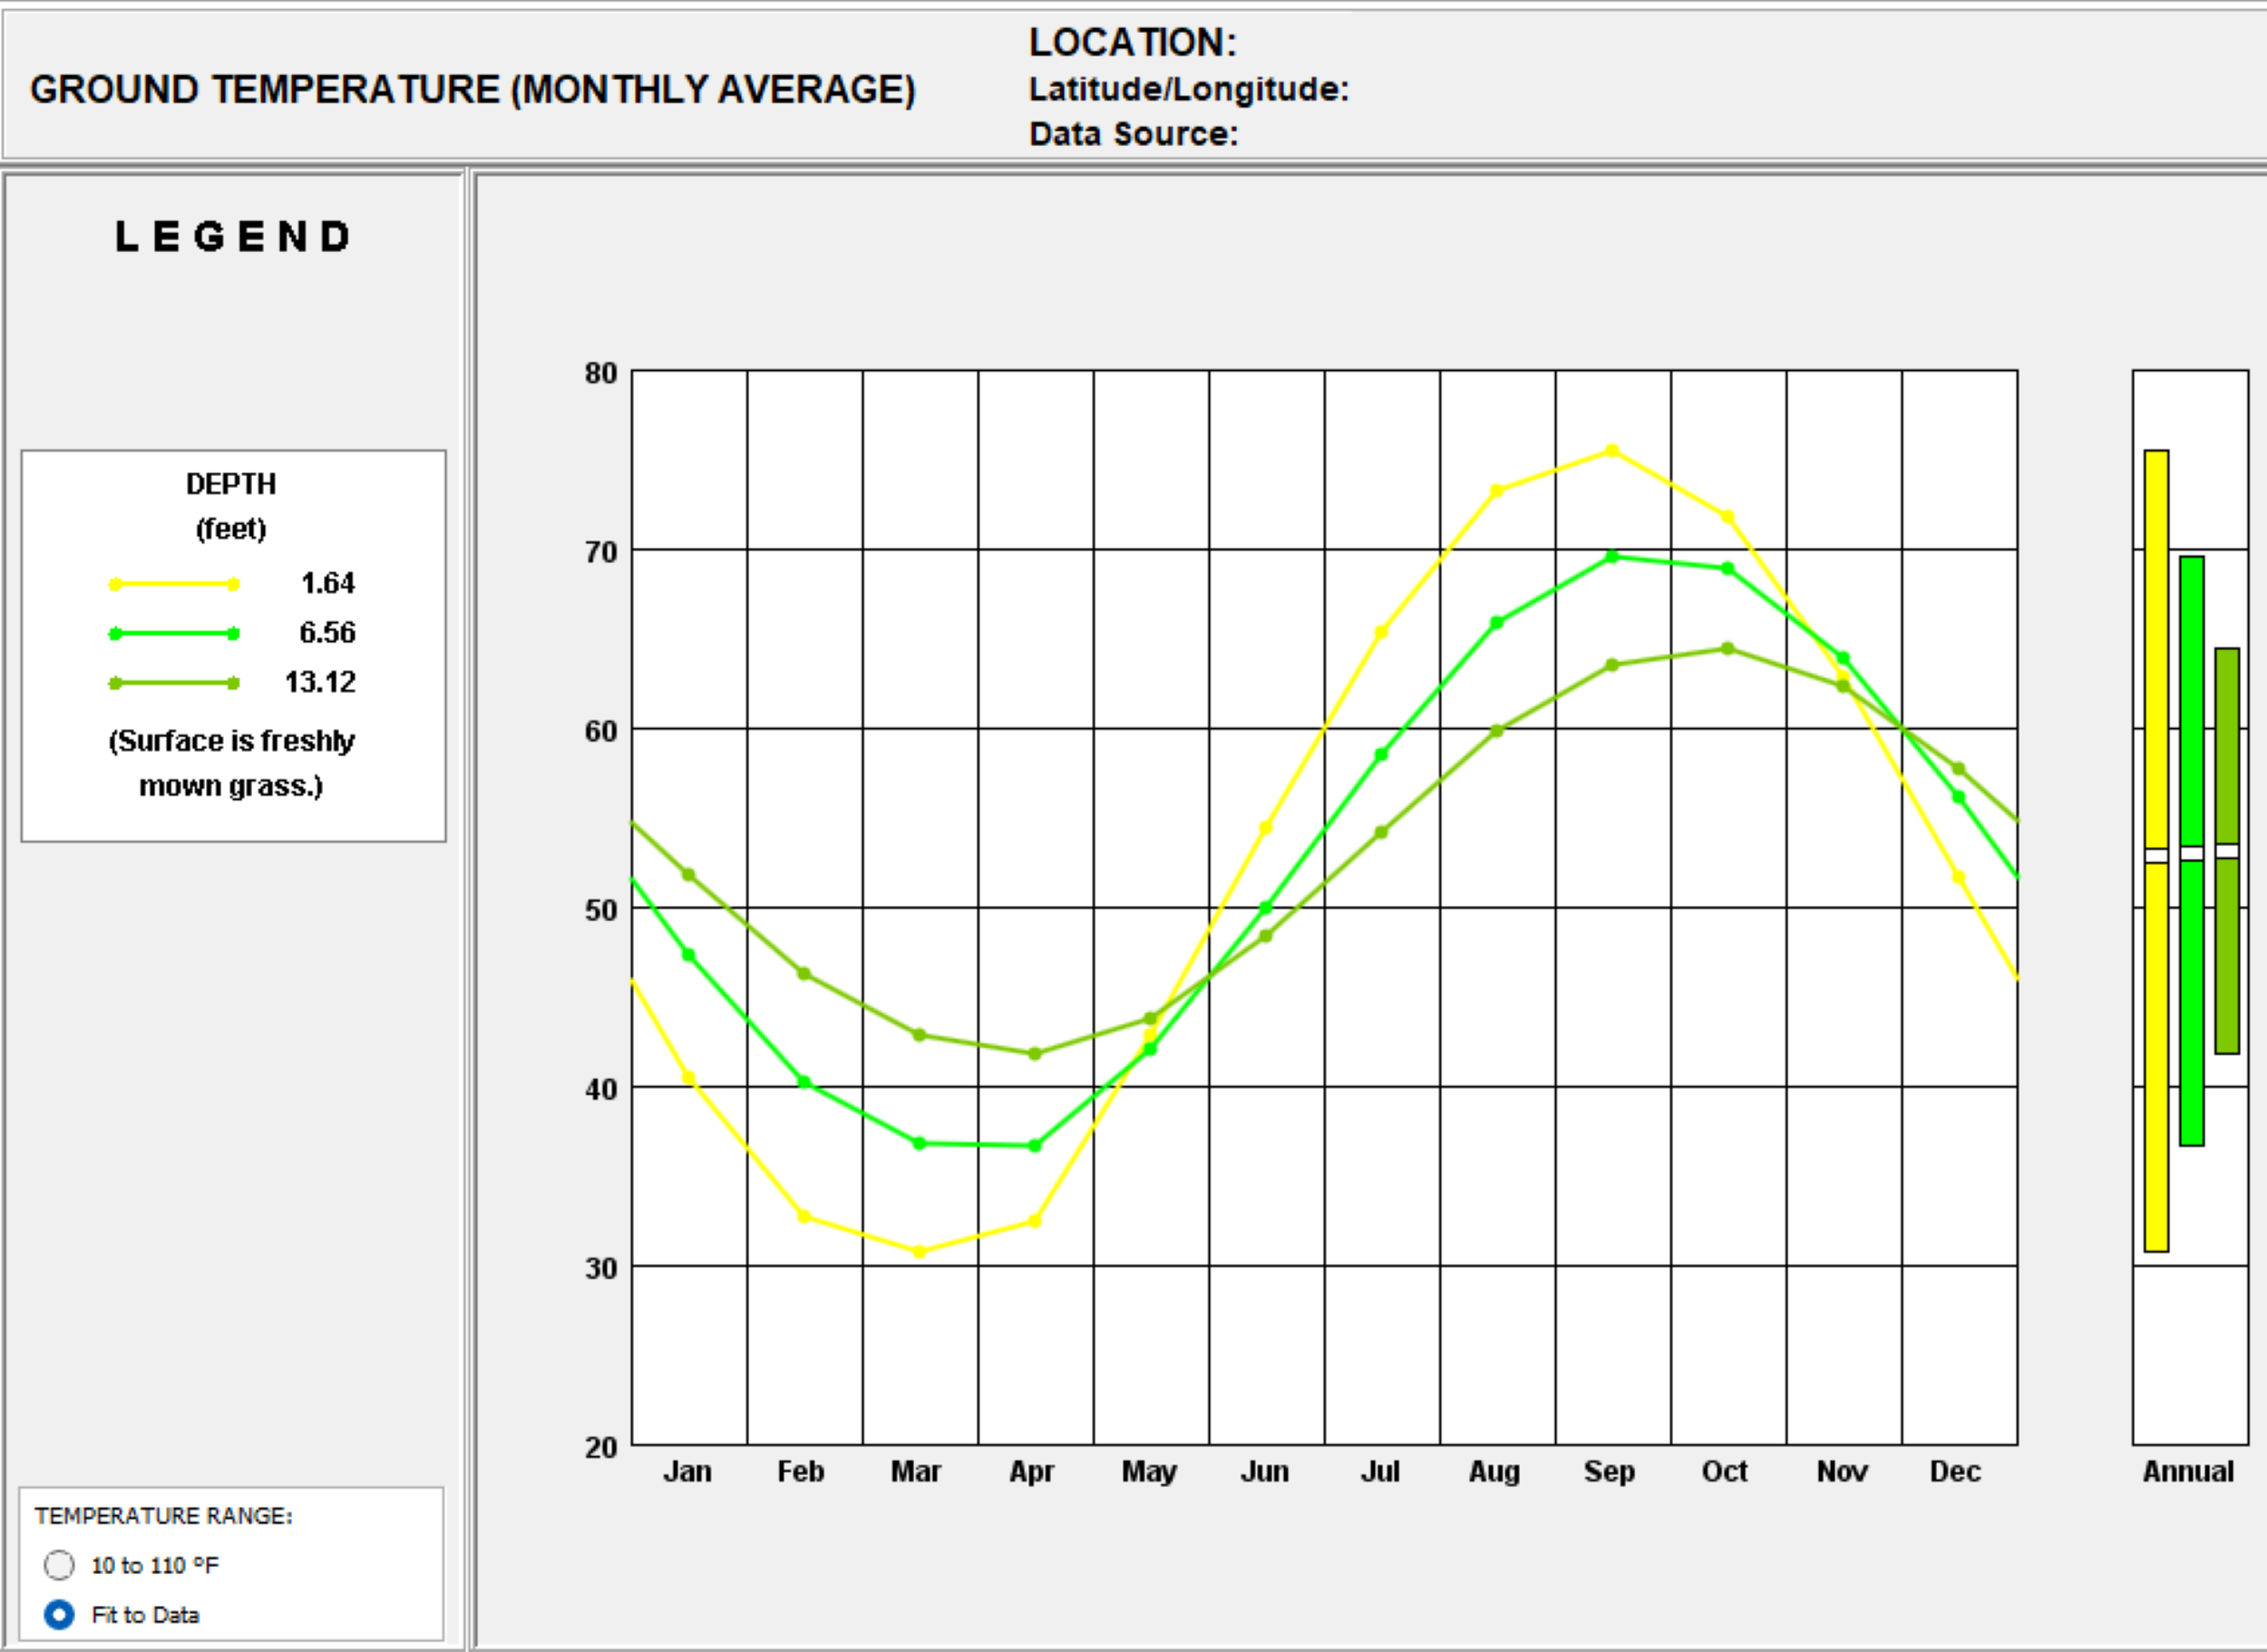
Monthly average ground temperature at varying depths, showing seasonal fluctuations – Click to enlarge
THERMAL MASS UTILIZATION
The Thermal Mass Utilization section highlights the potential of leveraging stable underground temperatures to regulate the greenhouse environment. By utilizing materials with high thermal mass, such as soil or water, in contact with deeper ground layers, the project can mitigate extreme temperature fluctuations and maintain a more consistent indoor climate. This approach is particularly effective due to the significant temperature stability observed at greater depths compared to surface levels. Below are the key insights:
- The chart indicates that at 13.12 feet depth, temperatures remain stable between 42-43°F in winter and 65°F in summer, showing less fluctuation compared to surface temperatures at 1.64 feet which range from 31°F to 75°F.
- For example, if you were to place thermal mass materials (such as soil or water) in contact with the deeper ground, you could utilize these stable temperatures to mitigate extreme temperature fluctuations inside the greenhouse.
HEATING AND COOLING STRATEGIES
The Heating and Cooling Strategies section explores how the stable temperatures of deeper ground layers can be harnessed to optimize the greenhouse’s thermal performance. By integrating geothermal systems or passive cooling techniques, the project can reduce energy consumption for heating and cooling while maintaining a stable and comfortable environment for plant growth. Below are the key strategies:
- During colder months, the ground temperature at 6.56 feet remains around 37-38°F while at 13.12 feet it stays at 42-43°F. Integrating ground-to-air heat exchangers or using geothermal heating methods can take advantage of this warmer ground to reduce the heating load of the greenhouse.
- Conversely, in the summer, the ground at 13.12 feet depth maintains 65°F while surface temperatures reach 75°F. This can be used for passive cooling by circulating air through underground ducts.
FOUNDATION INSULATION NEEDS
The ground temperatures at 1.64 feet show significant fluctuation from 31°F in winter to 75°F in summer, indicating that insulation around the base of the structure would be crucial to maintain desired temperatures.
PLANT ROOT ZONE MANAGEMENT
For crops that are sensitive to root temperatures, the data shows that at 1.64 feet depth, temperatures range from 31°F in winter to 75°F in summer, requiring careful management of root zone heating and cooling systems.
CONCLUSION
The Ground Temperature Chart shows that soil temperatures vary significantly by depth, from 31°F to 75°F at 1.64 feet and 42°F to 65°F at 13.12 feet. This data is highly relevant for designing efficient heating and cooling systems in the greenhouse, optimizing thermal mass use, and determining the insulation requirements. Understanding these ground temperature variations at different depths can guide decisions about energy use, contributing to a more sustainable design that reduces reliance on external energy sources while maintaining optimal growing conditions for plants.
Note – The project site may experience temperatures approximately 3.9°F cooler due to the elevation difference compared to the weather station data.
SUN SHADING CHART
The Sun Shading Chart provides a detailed visualization of the sun’s path and its impact on the greenhouse environment throughout the year. By mapping the sun’s bearing and altitude angles, temperature zones, and shading requirements, the chart helps in designing effective shading strategies to regulate temperature and optimize light conditions inside the greenhouse. Understanding these key elements is essential for managing heat gain and loss, ensuring that the greenhouse maintains an ideal environment for plant growth across different seasons.
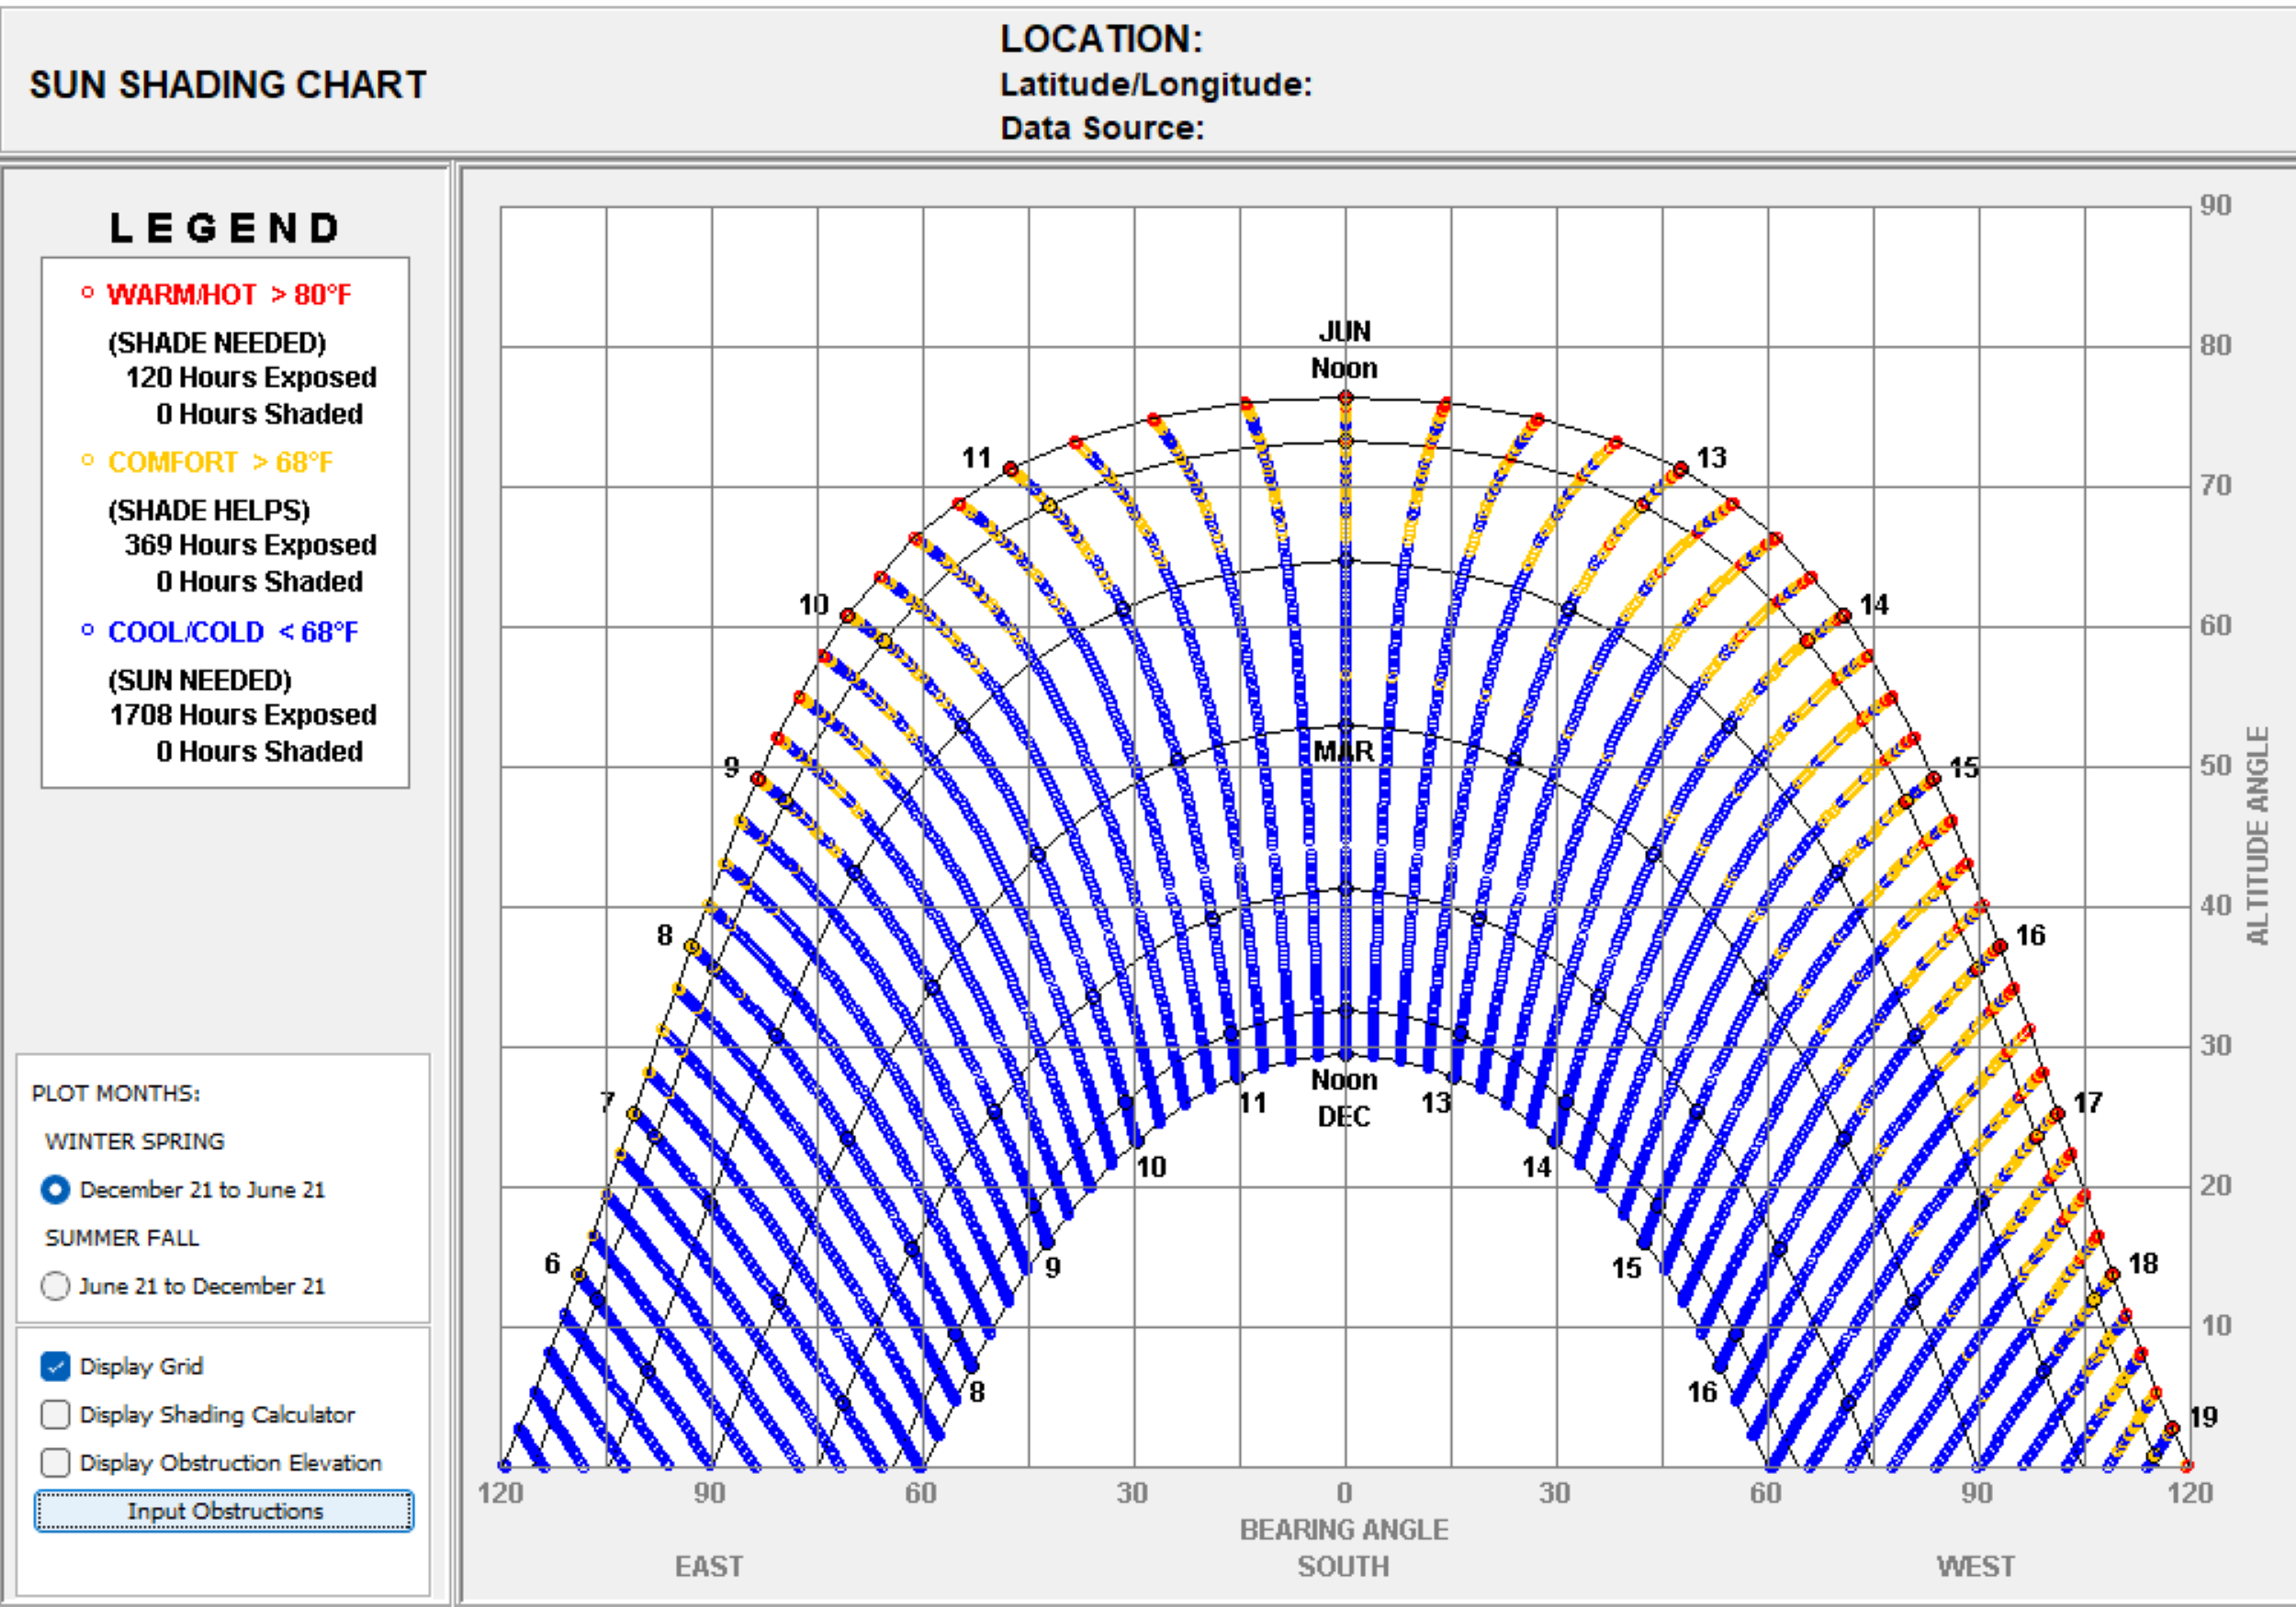
Sun shading chart showing thresholds for temperature and solar radiation to optimize shading strategies – Click to enlarge
KEY ELEMENTS OF THE SUN SHADING CHART
This section breaks down the critical components of the Sun Shading Chart and their significance for greenhouse design and operation.
BEARING ANGLE AND ALTITUDE ANGLE:
The Bearing Angle and Altitude Angle section illustrates the sun’s movement across the sky, helping to identify when and where sunlight will directly impact the greenhouse.
- The chart shows the sun’s path from -120° (East) to +120° (West) bearing angles, with altitude angles ranging from 0° to 90°, displaying the sun’s position throughout the day from sunrise to sunset.
- This information is crucial for determining when and where sunlight will directly hit the greenhouse and when it might be shaded by surrounding structures or vegetation.
TEMPERATURE ZONES AND SHADING NEEDS
The Temperature Zones and Shading Needs section categorizes different temperature conditions and their corresponding shading requirements.
The chart identifies different temperature zones:
- Warm/Hot (>80°F): Shown in red, requiring shading with 120 hours exposed and 0 hours shaded
- Comfort (>68°F): Shown in yellow, where shading helps with 369 hours exposed and 0 hours shaded
- Cool/Cold (<68°F): Shown in blue, requiring sun with 1708 hours exposed and 0 hours shaded
This helps decide where and when to implement shading devices or materials to keep the greenhouse comfortable for plant growth.
SEASONAL VARIATIONS
The Seasonal Variations section highlights how the sun’s path changes throughout the year, affecting shading strategies.
- The chart is divided into two seasonal periods: Winter-Spring (December 21 to June 21) and Summer-Fall (June 21 to December 21).
- June (summer solstice) shows the highest sun altitude at noon
- December (winter solstice) shows the lowest sun altitude at noon
EXPOSURE AND SHADING HOURS
The Exposure and Shading Hours section quantifies the total hours of direct sunlight and shading, guiding decisions on when to implement shading measures.
- The chart indicates the total hours that the greenhouse is exposed to direct sunlight and the total hours it remains shaded.
For example:
- Shade Needed: 120 hours of exposure with 0 hours shaded suggests that in some periods, shading will be necessary to maintain optimal conditions.
- Comfort Helps: 369 hours of exposure suggests times when shading might be beneficial to maintain comfort.
- Sun Needed: 1708 hours of exposure indicates periods where maximizing sun exposure is essential to prevent cold stress on the plants.
Note – The project site may experience different sun exposure patterns due to the elevation difference compared with weather station.
APPLICATIONS
The Applications section outlines practical ways to utilize the insights from the Sun Shading Chart to optimize greenhouse design, shading solutions, and energy efficiency. By aligning the greenhouse’s orientation, shading strategies, and energy management with the chart’s data, the project can create a sustainable and efficient growing environment. Below are the key applications:
- Optimize Placement and Orientation: Use this chart to ensure that the greenhouse is positioned to maximize sunlight exposure during the cold periods (1708 hours when sun is needed) and provide adequate shading during hot periods (120 hours when shade is needed). The bearing angles from -120° (East) to +120° (West) help determine optimal orientation.
- Design Shading Solutions: Implement shading solutions, such as retractable screens or external plantings, based on the 120 hours when shading is needed (>80°F) and 369 hours when shading helps maintain comfort (>68°F). The chart shows these requirements are most critical during summer months when the sun’s altitude is highest.
- Energy Efficiency and Sustainability:By strategically managing sunlight exposure and shading based on the chart’s temperature zones (warm/hot, comfort, and cool/cold), the greenhouse can maintain optimal growing conditions with minimal reliance on artificial heating or cooling, thereby achieving greater energy efficiency and sustainability.
THE PSYCHROMETRIC CHART
The Psychrometric Chart you provided is essential for understanding the thermal comfort conditions and selecting appropriate design strategies for the greenhouse environment. Here’s a breakdown of the key elements.
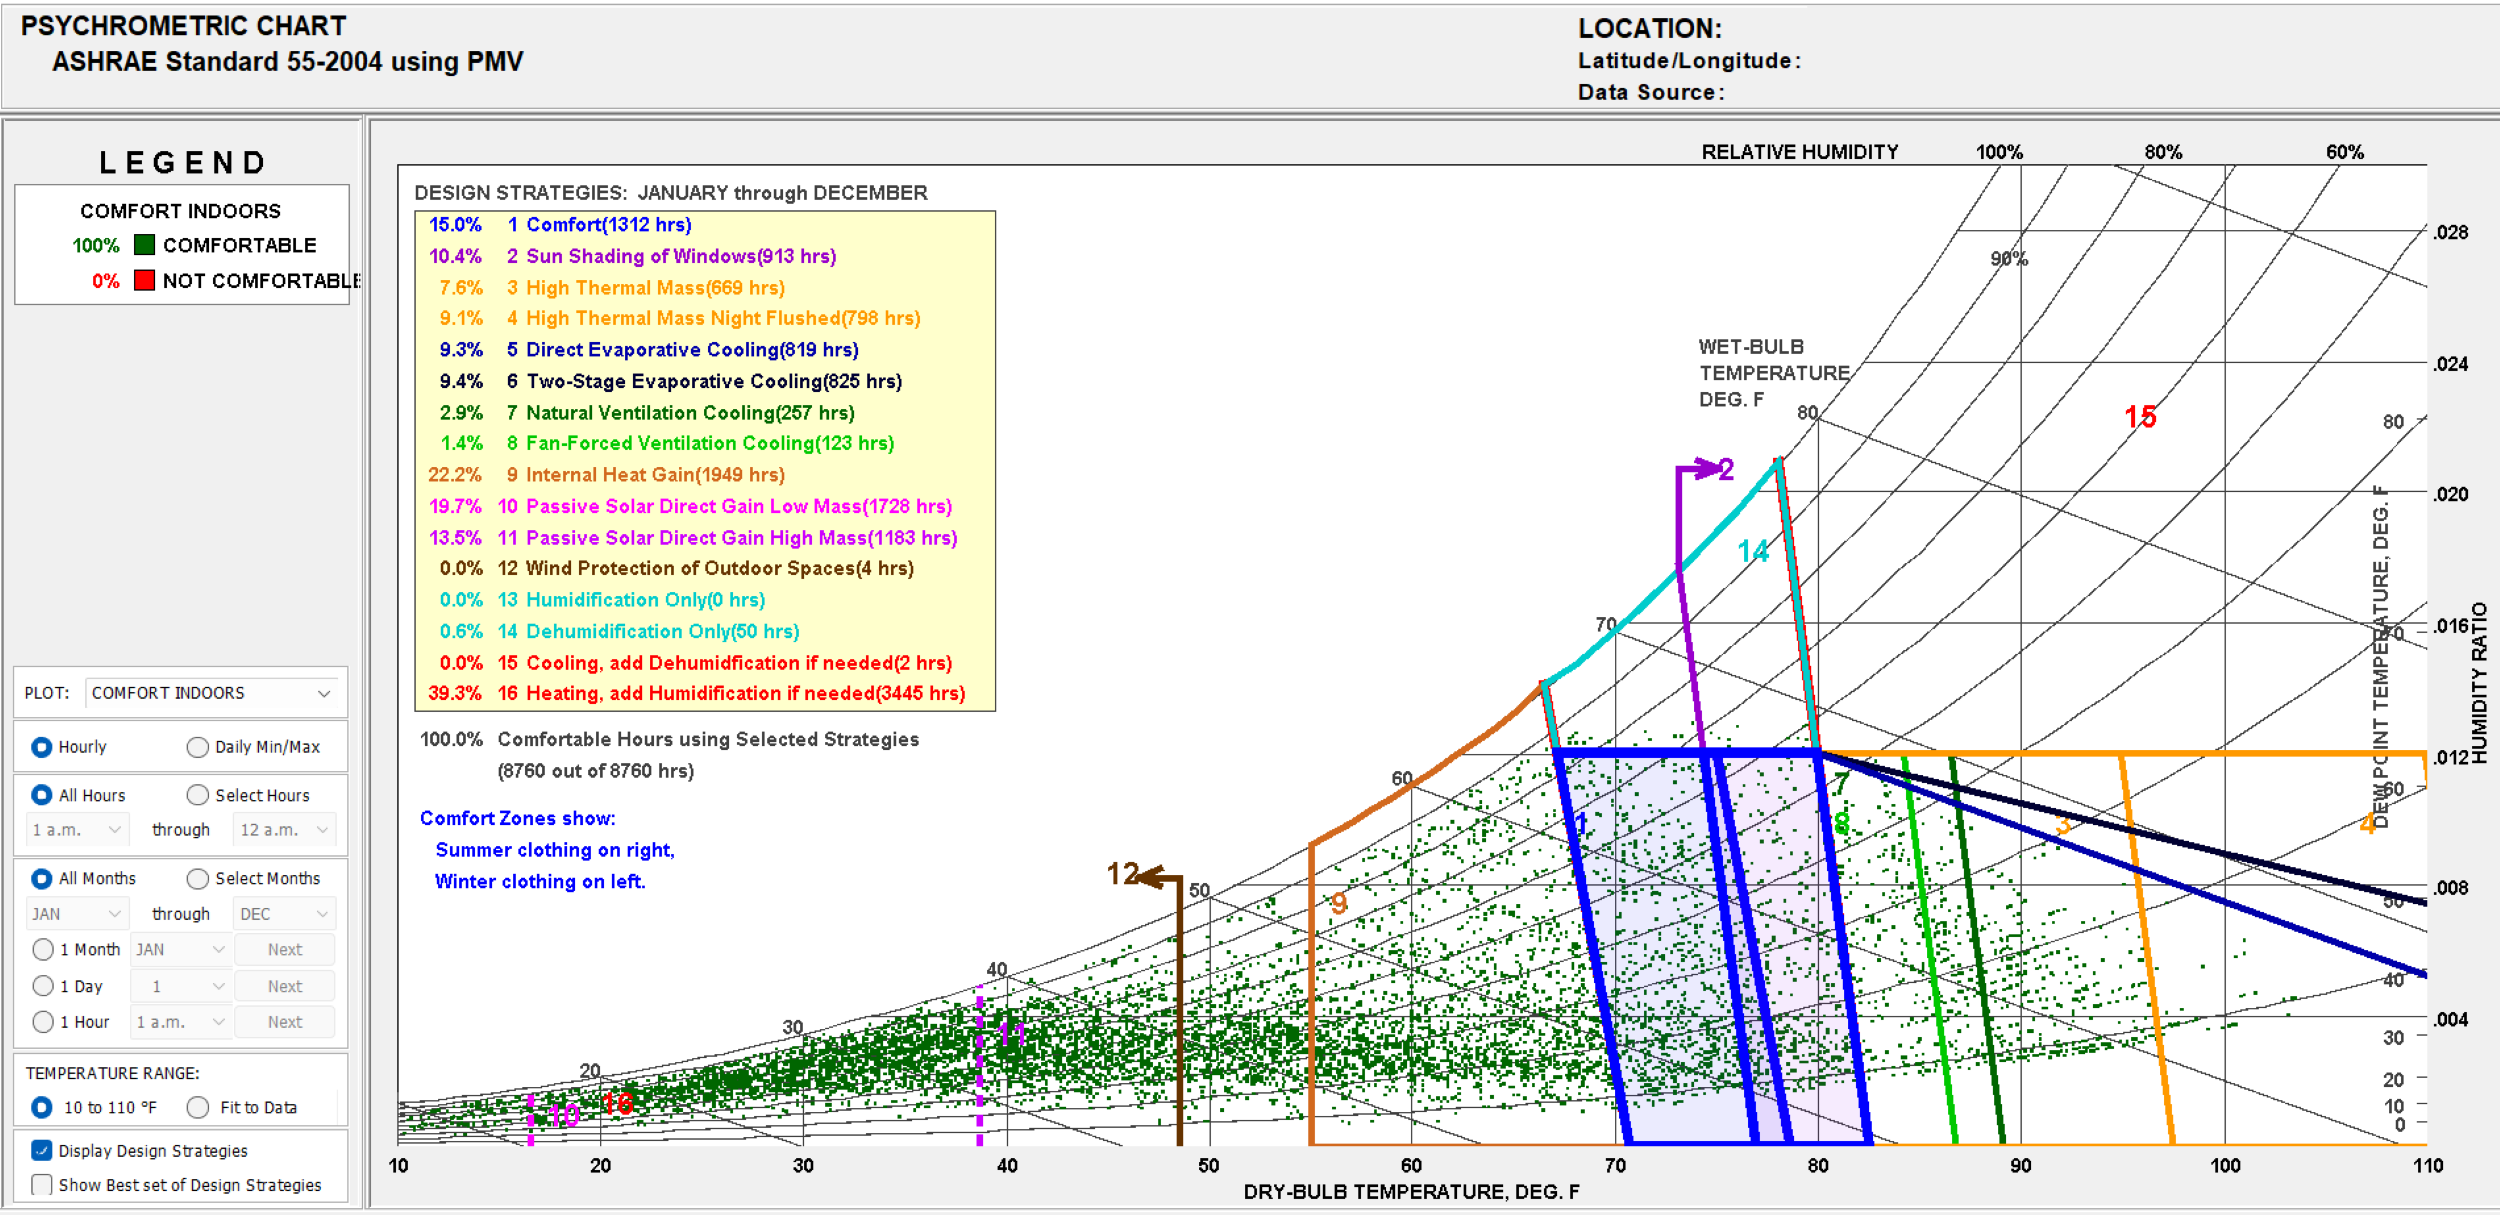
Psychrometric chart detailing comfort zones, humidity, and temperature ranges for optimal design – Click to enlarge
KEY ELEMENTS OF THE PSYCHROMETRIC CHART
The Psychrometric Chart is a powerful tool that illustrates the interplay between temperature, humidity, and various strategies for maintaining comfort within the greenhouse environment. It helps in visualizing how different climatic conditions affect thermal comfort and the corresponding interventions needed to create optimal growing conditions for plants. By understanding these key elements, we can make informed decisions on heating, cooling, ventilation, and humidity control strategies to support plant health and energy efficiency in the Greenhouse.
TEMPERATURE AND HUMIDITY RANGES
The Temperature and Humidity Ranges section highlights the fundamental relationship between dry-bulb temperature and relative humidity, which are essential for assessing thermal comfort and designing climate control systems.
- The chart shows the relationship between dry-bulb temperature (10°F to 110°F on horizontal axis) and relative humidity (curved lines from 0% to 100%), which are crucial for determining thermal comfort in the greenhouse.
- The chart is divided into different zones representing comfort levels and various design strategies based on temperature and humidity levels.
COMFORT ZONE
The Comfort Zone section of the psychrometric chart identifies the range of temperature and humidity conditions that are optimal for plant growth and human comfort. Understanding this zone is essential for designing climate control systems that maintain ideal growing conditions in the greenhouse. Below are the key insights:
- The comfort zone (shown in green dots) indicates the range of temperature and humidity conditions that are considered comfortable. In this context, it represents the conditions most favorable for plant growth.
- According to the chart, only 15% (1312 hours) of the total annual hours fall within the comfort zone without additional modifications.
DESIGN STRATEGIES
The Design Strategies section outlines various approaches to maintain optimal growing conditions in the greenhouse by leveraging the insights from the psychrometric chart. These strategies help regulate temperature and humidity, ensuring energy efficiency and plant health. Below are the key strategies:
- Sun Shading of Windows (10.4% or 913 hours): To reduce heat gain during hot periods.
- High Thermal Mass (7.6% or 669 hours): Use of materials with high thermal mass to absorb and store heat, stabilizing temperature fluctuations.
- High Thermal Mass Night Flushed (9.1% or 798 hours): Utilizing cool nighttime air to flush out accumulated heat from thermal mass.
- Direct Evaporative Cooling (9.3% or 819 hrs) and Two-Stage Evaporative Cooling (9.4% or 826 hours): Employing moisture to cool the air, particularly effective in low-humidity environments.
- Natural Ventilation (2.9% or 257 hours): Using air movement to maintain comfortable conditions.
- Internal Heat Gain (22.2% or 1949 hours): Using lighting, equipment, and people to contribute to the internal heat, is particularly useful during colder months.
- Passive Solar Direct Gain Low Mass (19.7% or 1728 hrs) and High Mass (13.5% or 1183 hrs): Maximizing solar gains to reduce heating requirements.
CRITICAL INTERVENTIONS
The Critical Interventions section highlights the essential climate control measures required to maintain optimal growing conditions in the greenhouse, particularly during extreme temperature and humidity conditions. These interventions ensure that the greenhouse environment remains stable and conducive to plant growth. Below are the key interventions:
- Heating, Add Humidification if Needed (39.3% or 3445 hours): Significant hours are required for heating, especially during colder periods. Humidification is necessary to maintain optimal moisture levels.
- Dehumidification Only (0.6% or 50 hours): Limited hours when dehumidification without cooling is required.
- Cooling, Add Dehumidification if Needed (0.0% or 2 hours): Almost negligible need for combined cooling and dehumidification, indicating dry conditions.
APPLICATIONS
The Applications section translates the insights from the psychrometric chart into actionable strategies for optimizing greenhouse climate control. By aligning heating, cooling, shading, and thermal mass strategies with the chart’s data, the project can achieve energy efficiency, maintain optimal growing conditions, and reduce operational costs. Below are the key applications:
- Optimize Heating and Cooling Strategies: The chart indicates that heating and humidification is required for 39.3% (3445 hrs) of the year. This can guide the integration of efficient heating systems and use of passive solar design (33.2% or 2911 hrs combined for low and high mass) to reduce energy consumption.
- Shading and Ventilation: Implement sun shading (10.4% or 913 hrs) and natural ventilation (2.9% or 257 hrs) techniques as indicated to manage heat gain and improve comfort, especially during peak sunlight hours. Direct and two-stage evaporative cooling strategies are effective for 18.7% (1645 hrs) of the year.
- Thermal Mass Utilization: Utilize materials with high thermal mass in the design to stabilize temperature fluctuations and improve energy efficiency, aligning with 7.6% (666 hrs) of total hours where thermal mass strategies are effective, with an additional 9.1% (798 hrs) benefiting from night flushing of thermal mass.
Note – The project site may experience:
- Air pressure approximately 4% lower
- Humidity ratios approximately 4% lower at the same relative humidity
- Wet bulb temperatures 2-3°F lower
- Evaporative cooling potentially more effective due to lower atmospheric pressure
TEMPERATURE RANGE CHART
The Temperature Range Chart is a crucial tool for understanding the local climate conditions throughout the year. It provides detailed information about the temperature variations, helping to identify the heating and cooling needs of the greenhouse. The chart includes recorded and designed high and low temperatures, average temperatures, and the comfort zone based on the ASHRAE Standard 55 using PMV (Predicted Mean Vote). This data is essential for optimizing the thermal performance of Greenhouse and ensuring a stable environment for plant growth.
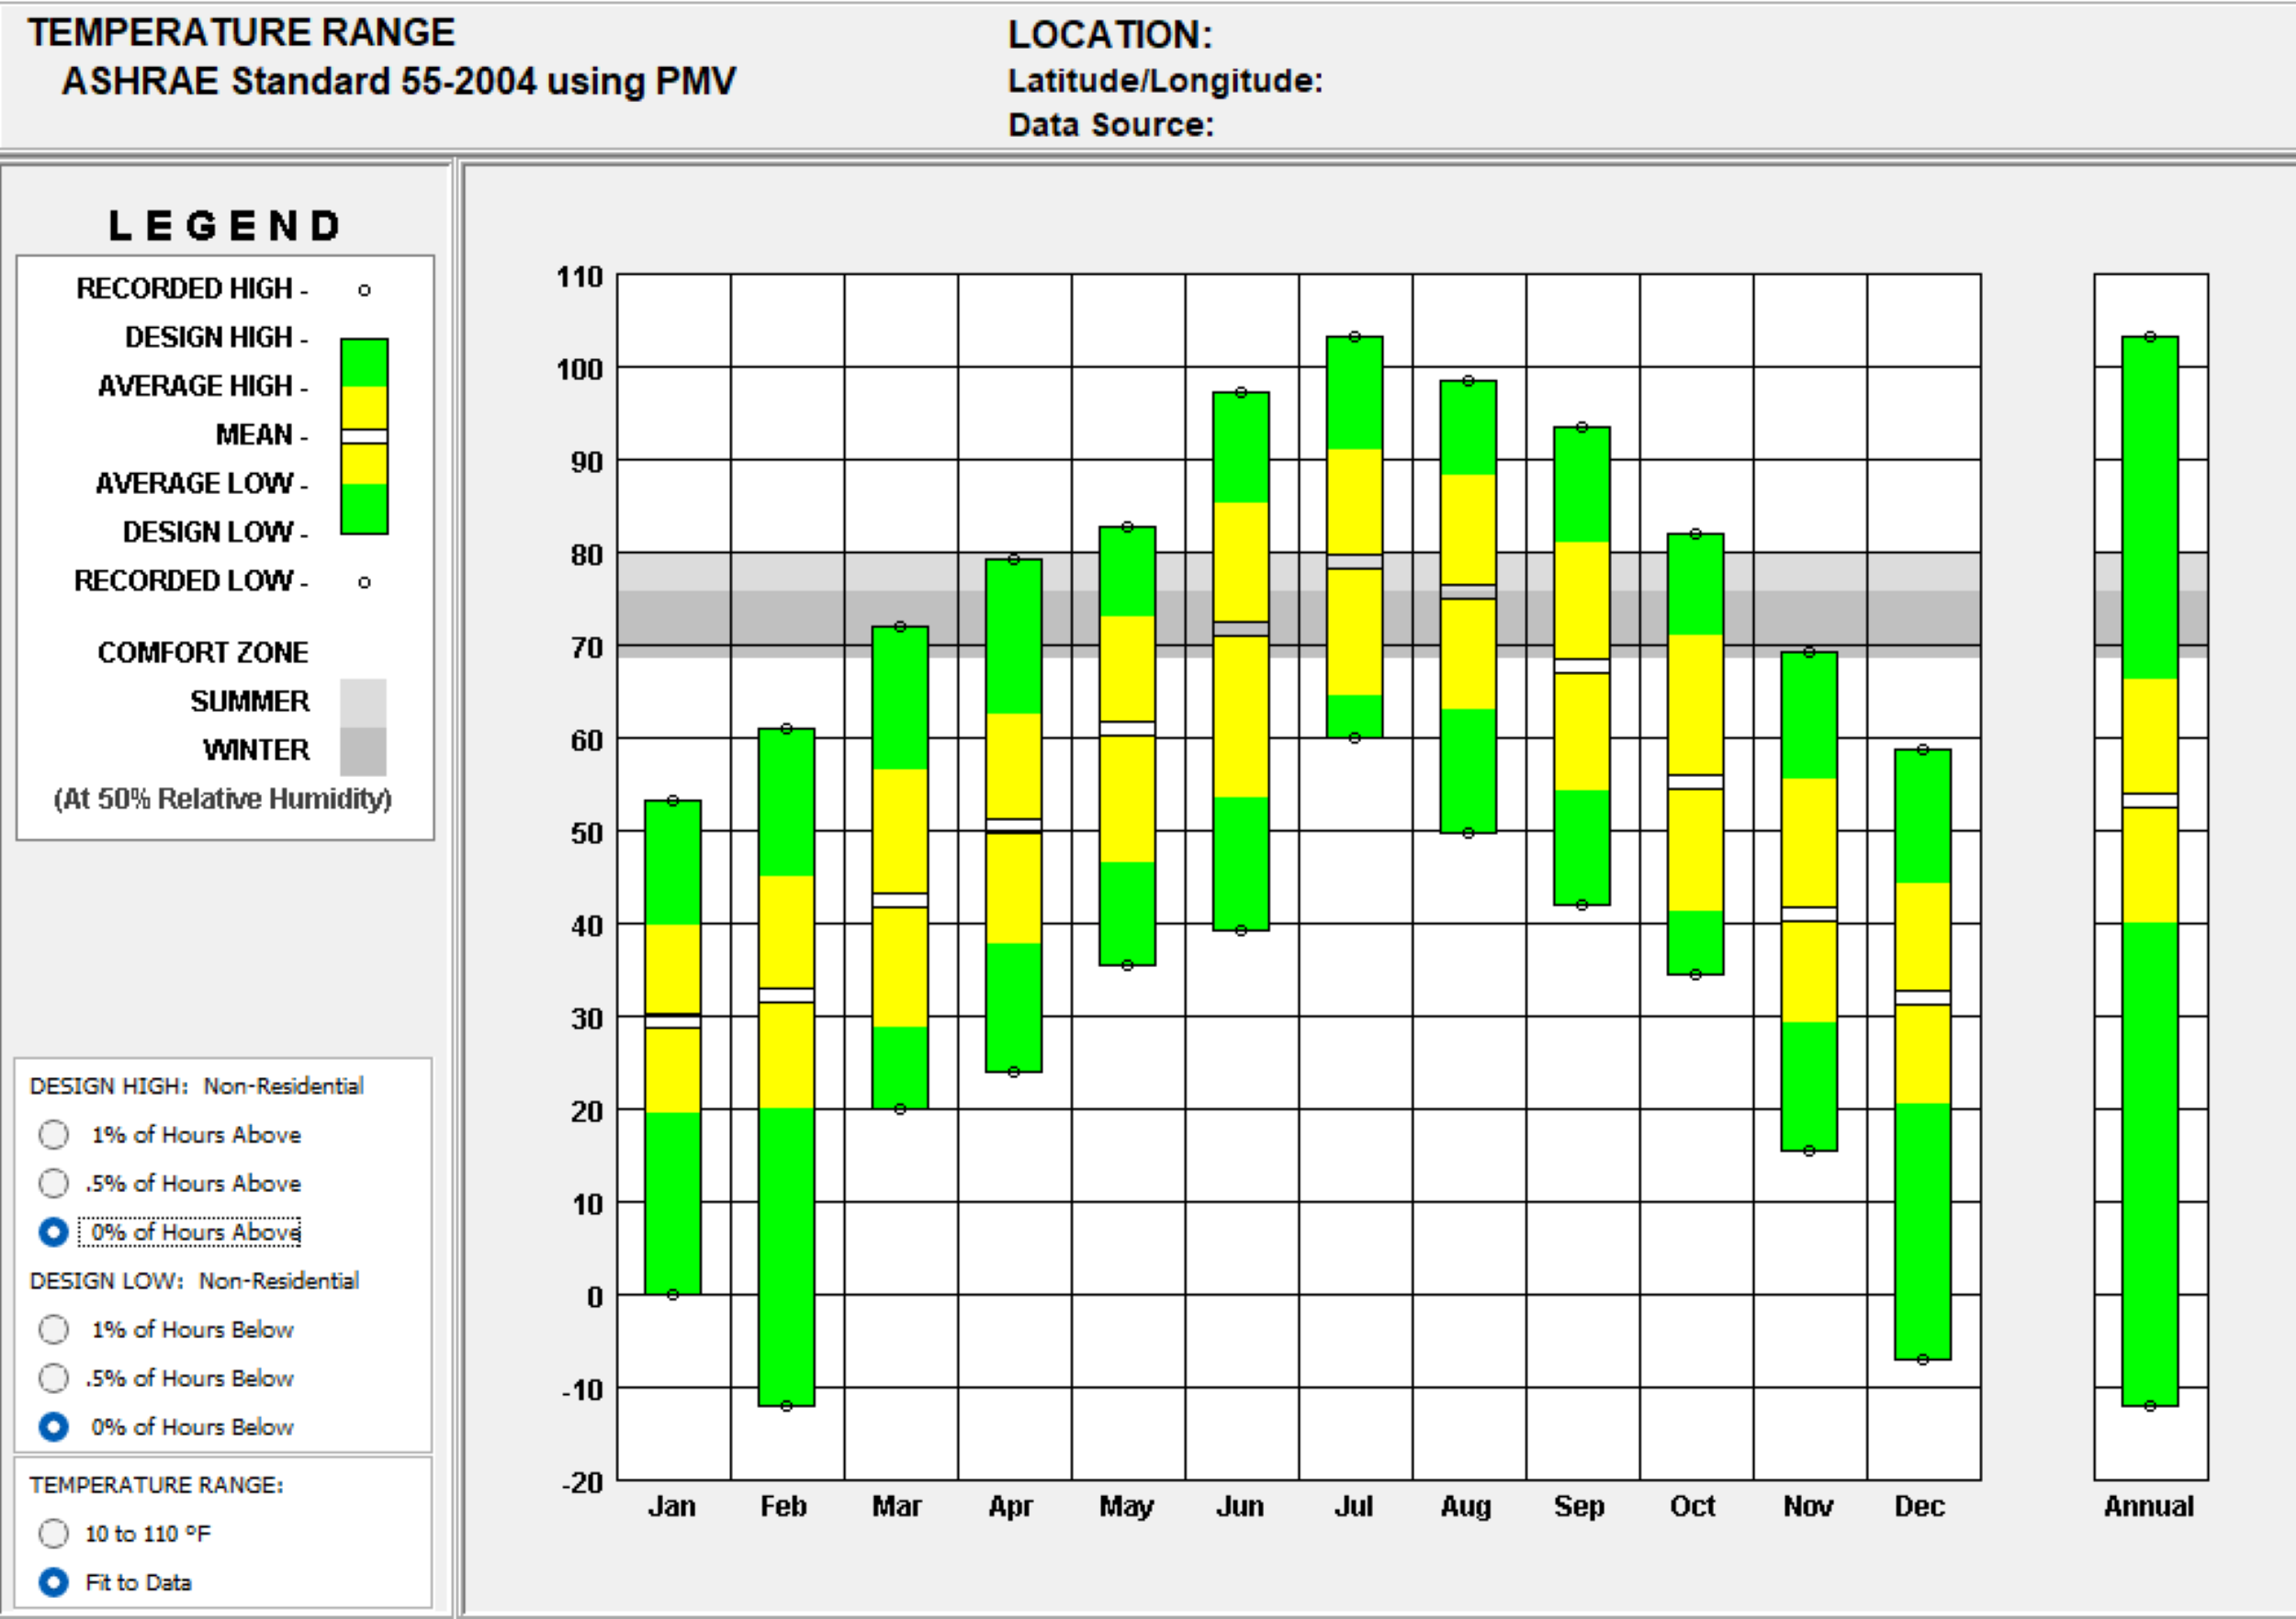
Annual temperature range with ASHRAE comfort zones for summer and winter conditions – Click to enlarge
Note – The project site is located at a higher altitude compared with the weather station data so the site may experience:
- All temperature ranges approximately 3.9°F cooler
- Design high and low temperatures shifted down by ~4°F
- Comfort zone adjustments needed for the cooler conditions
- Greater temperature fluctuations due to thinner atmosphere
KEY INSIGHTS
This section highlights the critical insights derived from the Temperature Range Chart and their implications for greenhouse design and operation.
RECORDED HIGH AND LOW TEMPERATURES:
This explains the extreme temperature conditions the greenhouse may face.
- The chart displays the recorded high temperatures reaching above 100°F in summer months and low temperatures dropping below -10°F in winter months.
- This information helps to understand the extremities the greenhouse may face and prepare for these conditions by adjusting the structural design and material choices to mitigate heat loss or gain.
AVERAGE TEMPERATURE RANGE
This outlines the typical temperature ranges throughout the year.
- The average temperature is represented by the yellow and green bars,showing winter averages between 30-45°F and summer averages between 70-85°F.
- Knowing the average range is useful for setting up automated climate control systems that can adjust to these predictable conditions, reducing the need for manual interventions.
DESIGN HIGH AND LOW
This highlights the design temperatures used for HVAC system planning.
- The design high and low temperatures peak at approximately 103°F in July, while design low temperatures reach around -12°F in February.
- These values are typically used to determine the capacity of HVAC systems required to maintain optimal growing conditions in the greenhouse, ensuring that systems are neither under nor over-specified.
COMFORT ZONE ANALYSIS
This explains the ideal temperature ranges for plant growth and greenhouse design.
- The chart includes comfort zones marked between 70-75°F for winter and 73-80°F for summer at 50% relative humidity.
- This information is crucial to ensure that the greenhouse remains within a suitable temperature range for the plants. For Greenhouse, the focus will be on maintaining temperatures within the comfort zone to avoid plant stress and support optimal growth. The goal is to design the greenhouse such that it maximizes the time spent within these comfort zones.
SEASONAL ADJUSTMENTS
This highlights the seasonal temperature variations and their implications for greenhouse management.
- The chart indicates significant seasonal variations in temperature. For instance, there is a noticeable drop in temperatures from November to February, with lows reaching -10°F in February, requiring additional heating.
- Conversely, from May to September, high temperatures reaching above 100°F in July might necessitate shading and ventilation to prevent overheating.
APPLICATION TO GREENHOUSE
The Application to Greenhouse section outlines how the insights from the Temperature Range Chart can be used to design and optimize greenhouse systems for maintaining stable internal temperatures. By addressing thermal insulation, heating, ventilation, and automation, the project can create a sustainable and efficient growing environment. Below are the key applications:
THERMAL INSULATION
The Thermal Insulation application emphasizes the need for robust insulation to mitigate extreme temperature fluctuations.
- The chart data shows temperatures dropping to -10°F in February and reaching above 100°F in July, indicating that robust thermal insulation will be necessary to maintain stable internal temperatures.
- Insulating the foundation and walls can significantly reduce heat loss during the extreme temperature swings of 110°F throughout the year.
HEATING SYSTEMS
The Heating Systems application highlights the importance of efficient heating solutions to address prolonged cold periods.
- The need for heating is evident with winter temperatures consistently below the comfort zone (70-75°F), particularly from November through March when temperatures frequently fall below 32°F.
- Ground-source heat pumps or other energy-efficient heating systems should be considered to maintain the greenhouse within the desired temperature range without excessive energy use.
VENTILATION AND COOLING
The Ventilation and Cooling application focuses on managing high summer temperatures through passive and active cooling strategies.
- During June through August when temperatures exceed 90°F and reach up to 103°F, efficient ventilation will be essential.
- Implementing passive cooling techniques, such as earth tubes, can help utilize cooler ground temperatures to reduce internal heat during these peak summer months.
DESIGN CONSIDERATIONS
The Design Considerations application explores how building orientation and thermal mass can enhance energy efficiency.
- With average temperatures ranging from 30-45°F in winter to 70-85°F in summer, the building’s orientation and the use of thermal mass will help absorb heat during the day and release it at night, minimizing the need for artificial heating.
- The use of retractable shades or solar screens can help manage excess solar gain when temperatures exceed 90°F in summer months.
AUTOMATION AND CONTROL SYSTEMS
The Automation and Control Systems application underscores the importance of real-time monitoring and adaptive systems. Automated systems that can respond to real-time temperature data will be crucial, during spring and fall when daily temperature fluctuations are most significant, as shown by the wider temperature ranges in these transition months.
MONTHLY DIURNAL AVERAGES CHART
The Monthly Diurnal Averages Chart displays the daily and monthly variations in key climate parameters, including temperature (dry bulb and wet bulb) and solar radiation types (global horizontal, direct normal, and diffuse). This detailed visualization helps identify patterns in temperature and sunlight throughout the day and across seasons, providing critical insights for managing the greenhouse microclimate and optimizing growing conditions.
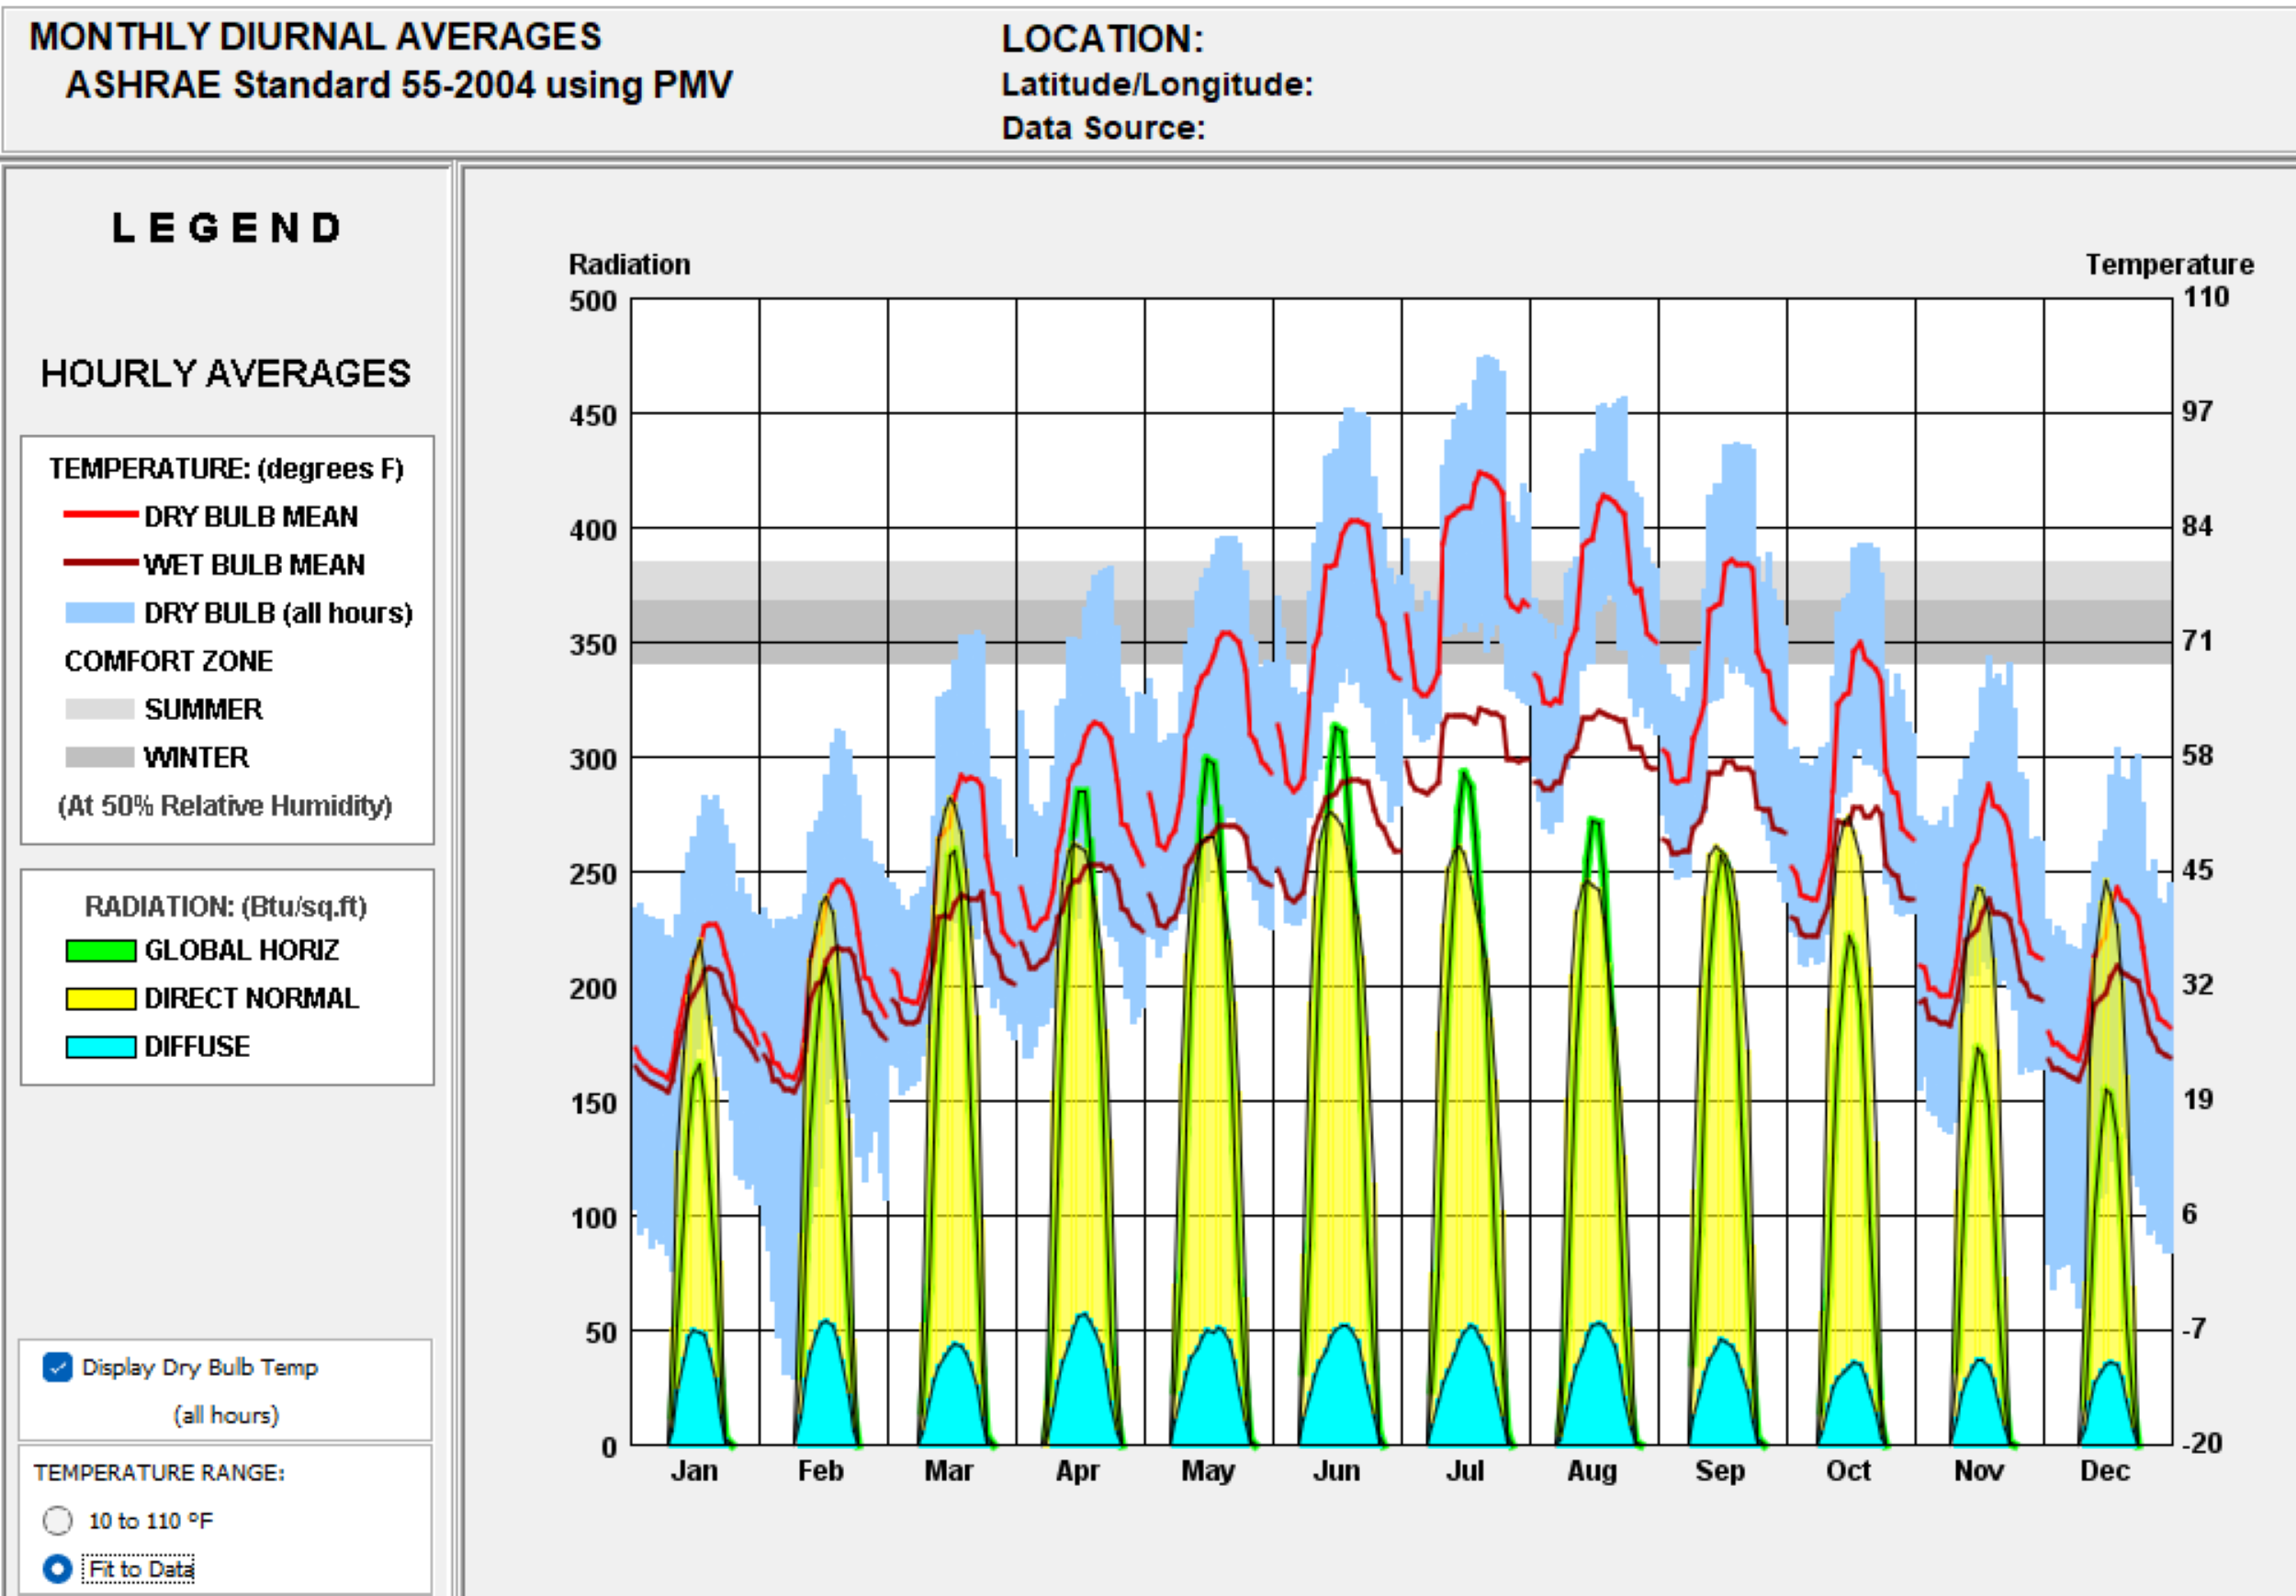
Monthly diurnal averages showing temperature and solar radiation patterns for climate analysis – Click to enlarge
Note – The project site is located at a higher altitude compared with the weather station data so the site may experience:
- Temperatures approximately 3.9°F cooler
- Solar radiation intensity approximately 11.3% higher due to thinner atmosphere
- Slightly lower wet bulb temperatures due to reduced air pressure
- More distinct separation between direct and diffuse radiation due to clearer
KEY ELEMENTS OF THE CHART
The Key Elements of the Chart section breaks down the critical components of the Monthly Diurnal Averages Chart, focusing on temperature averages and radiation types. These elements provide insights into daily and seasonal trends, helping to identify periods when interventions may be needed to maintain optimal growing conditions. Below are the key elements:
TEMPERATURE AVERAGES
The Temperature Averages section highlights the daily and monthly variations in dry bulb and wet bulb temperatures, which are critical for assessing thermal comfort and humidity levels.
- Dry Bulb Mean (Red Line): Indicates the average air temperature at each hour of the day for each month, ranging from approximately 20°F in winter mornings to 85°F in summer afternoons. The data shows a peak during the summer months, which is crucial for understanding the heat load within the greenhouse.
- Wet Bulb Mean (Purple/Magenta Line): Represents the temperature a parcel of air would have if cooled to saturation (100% relative humidity) by the evaporation of water into it. This is important for understanding potential humidity levels and the need for cooling strategies.
- Comfort Zone: The grey band shows the temperature range between approximately 70°F to 75°F in winter and extends slightly higher in summer is considered comfortable for plant growth. It helps identify periods when conditions fall outside the optimal range, requiring intervention.
RADIATION TYPES
The Radiation Types section illustrates the variations in solar radiation, which directly impacts plant growth and greenhouse energy management.
- Global Horizontal Radiation (Green Area): Represents the total solar radiation received per unit area on a horizontal surface, reaching maximum values of approximately 450 Btu/sq.ft in summer months. It is an important factor for determining the overall solar energy availability for the greenhouse.
- Direct Normal Radiation (Yellow Area): Measures the direct sunlight reaching the surface, reaching peaks of 250-300 Btu/sq.ft during mid-day hours from May through July. It’s useful for understanding the intensity and duration of direct sunlight, which affects plant growth and potential overheating.
- Diffuse Radiation (Blue Area): Indicates sunlight that has been scattered by molecules and particles in the atmosphere, showing consistent levels around 50 Btu/sq.ft throughout daylight hours. It’s useful for understanding light conditions under cloudy or shaded situations.
APPLICATION TO GREENHOUSE DESIGN
The Application to Greenhouse Design section translates the insights from the Monthly Diurnal Averages Chart into actionable strategies for optimizing greenhouse operations. By leveraging data on natural light, temperature, humidity, and radiation, the project can create a sustainable and efficient growing environment. Below are the key applications:
NATURAL LIGHT UTILIZATION
The Natural Light Utilization application focuses on maximizing sunlight to reduce reliance on artificial lighting while addressing seasonal variations.
- The chart indicates high levels of direct normal radiation peaks at 250-300 Btu/sq.ft during summer months (May to July), with global horizontal radiation reaching 450 Btu/sq.ft. This suggests the potential to maximize natural light and reduce the need for artificial lighting during these periods.
- Conversely, lower radiation levels during winter months (November to January), dropping to around 150-200 Btu/sq.ft, indicate a need for supplemental lighting to maintain optimal plant growth.
TEMPERATURE CONTROL STRATEGIES
The Temperature Control Strategies application addresses the need for cooling and heating to maintain stable growing conditions.
- The high summer dry bulb temperatures reaching 84°F require cooling strategies to prevent overheating within the greenhouse. Techniques such as natural ventilation or shading devices can be employed to maintain comfortable conditions.
- During the winter, lower temperatures shown on the dry bulb mean line dropping to 20°F suggest the need for additional heating. Ground-to-air heat exchangers or thermal mass utilization could be effective in maintaining a stable internal temperature.
HUMIDITY MANAGEMENT
The Humidity Management application highlights the importance of regulating moisture levels to ensure optimal plant growth.
- Wet bulb temperatures indicate the potential humidity levels inside the greenhouse, tracking consistently below the dry bulb temperature by 10-15°F throughout the year.
- Understanding these values helps in planning for dehumidification or humidification systems to maintain an optimal growing environment, especially during periods of high or low relative humidity.
ENERGY MANAGEMENT
The Energy Management application explores how radiation data can inform energy-efficient practices.
- The radiation data shows distinct patterns: direct normal (yellow area) peaks at 250-300 Btu/sq.ft, while diffuse radiation (cyan area) remains consistent around 50 Btu/sq.ft.
- During periods of high direct normal radiation, solar panels can generate more energy, reducing the reliance on external power sources for lighting and HVAC systems.
SEASONAL ADJUSTMENTS
The Seasonal Adjustments application emphasizes the need for adaptive strategies to address temperature and radiation variations throughout the year.
- The chart shows temperature variations from 20°F in winter mornings to 84°F in summer afternoons, with corresponding radiation patterns.
- This data is essential for planning seasonal adjustments to the greenhouse operation. For example, implementing shading devices in summer or enhancing thermal insulation in winter can be planned based on these specific temperature and radiation patterns.
WIND VELOCITY RANGE CHART
The Wind Velocity Range chart presents the monthly variations in wind speed, including average, high, and low velocities. This data helps in understanding the potential impact of wind on the structural stability and ventilation efficiency of the greenhouse. By analyzing this information, we can design a more resilient and energy-efficient greenhouse that optimizes natural ventilation and reduces the need for mechanical systems.
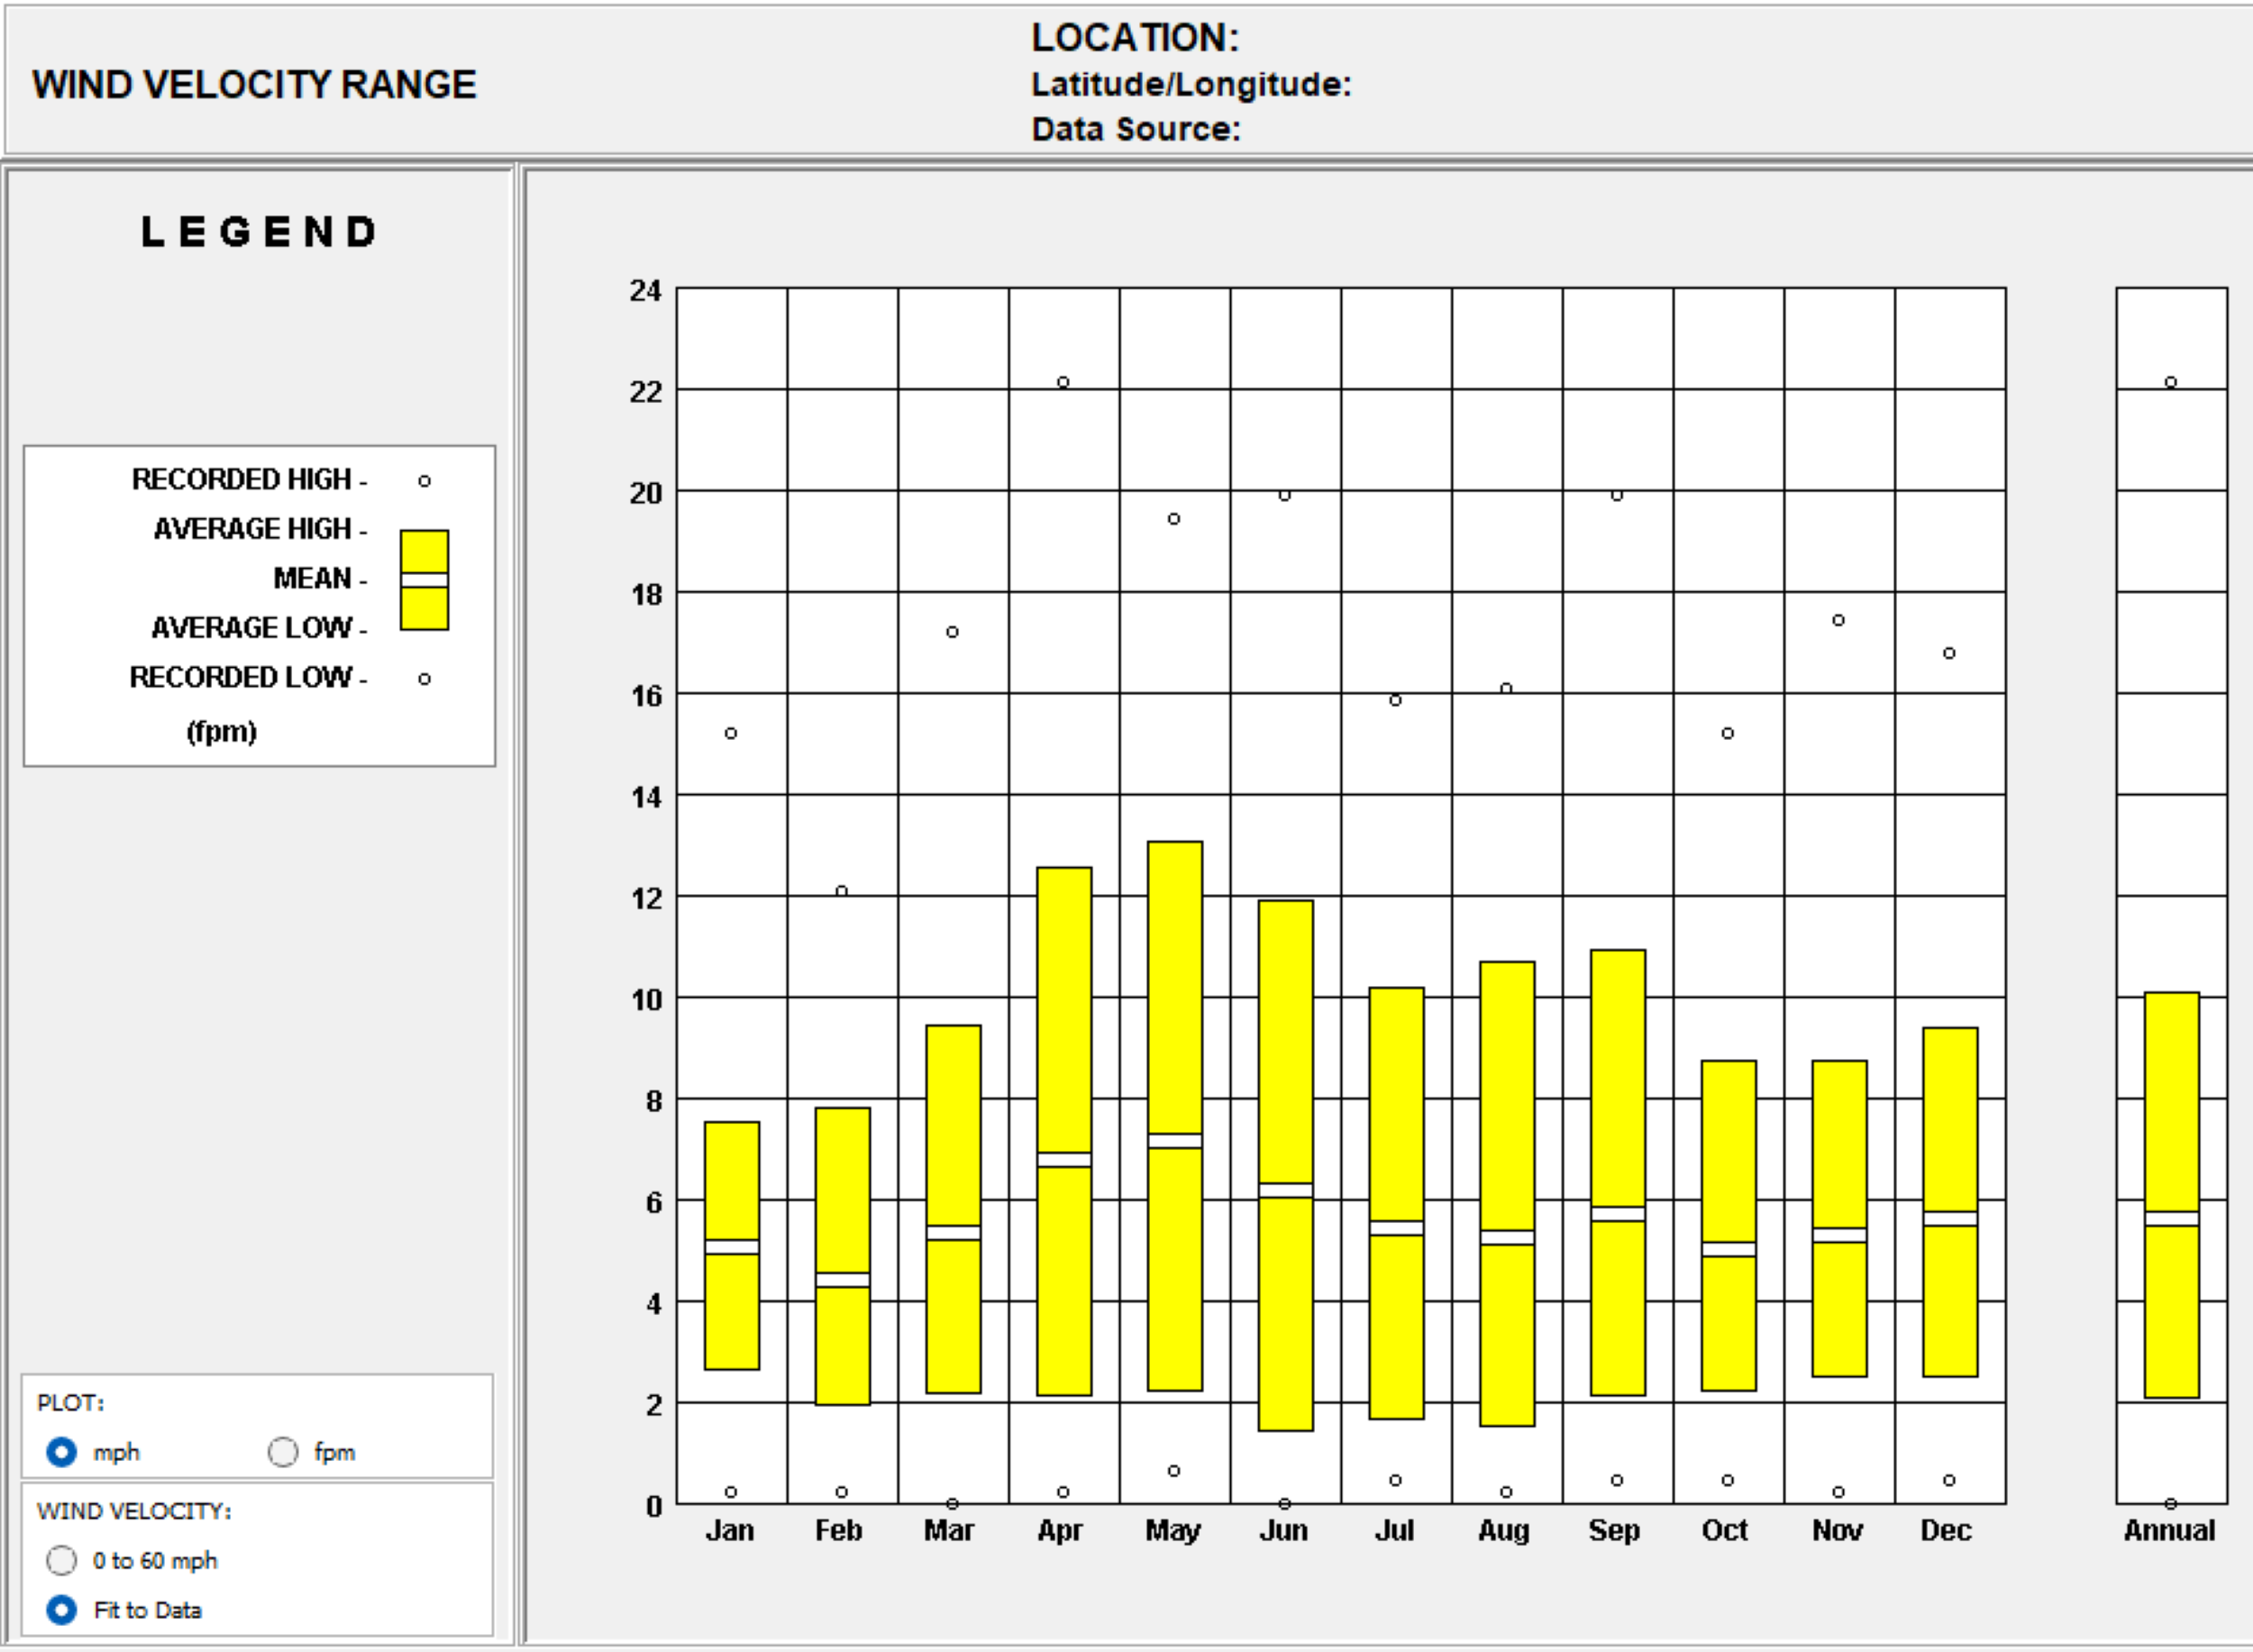
Annual wind velocity range chart showing recorded and average wind speeds for greenhouse ventilation planning – Click to enlarge
Note – The project site is located at a higher altitude compared with the weather station data so the site may experience:
- Wind velocities potentially 10-15% stronger due to reduced air density
- More turbulent wind patterns due to altitude differences
- Greater variation in wind speeds throughout the day
- Potentially different prevailing wind directions due to local terrain
KEY INSIGHTS
The Key Insights section breaks down the critical observations from the Wind Velocity Range Chart, focusing on how wind speed variations can inform greenhouse design and operational strategies. Below are the key insights:
MONTHLY WIND SPEED VARIATIONS
The Monthly Wind Speed Variations section highlights the seasonal changes in wind speed and their implications for natural ventilation.
- The chart indicates that wind speeds vary significantly throughout the year, with peaks observed in April and May reaching 12-13 fpm.
- These higher wind speeds can be utilized to enhance natural ventilation, reducing the need for mechanical ventilation during these months.
LOW WIND SPEED PERIODS
The Low Wind Speed Periods section addresses the challenges of maintaining airflow during periods of minimal wind.
- There are periods with relatively low wind speeds, especially in January and February (2-7 fpm).
- During these times, the greenhouse might need additional mechanical ventilation or circulation fans to maintain adequate airflow and prevent heat build-up.
DESIGNING FOR STRUCTURAL STABILITY
The Designing for Structural Stability section emphasizes the importance of building a greenhouse that can withstand occasional high winds.
- The highest recorded wind speeds reach 22 fpm in spring months, although infrequent.
- This highlights the need to design the greenhouse structure to withstand these occasional peaks. This ensures that the greenhouse can remain intact during unexpected high wind events, maintaining a stable environment for plant growth.
UTILIZATION OF WIND FOR COOLING
The Utilization of Wind for Cooling section explores how wind can be harnessed to reduce internal temperatures during warmer months.
- During warmer months (June-August), wind speeds average 6-10 fpm.
- By designing the greenhouse with strategically placed vents or operable windows, the greenhouse can utilize these winds to lower internal temperatures, reducing the need for artificial cooling.
IMPLICATIONS FOR ORIENTATION AND WINDBREAKS
The Implications for Orientation and Windbreaks section discusses how wind patterns can influence greenhouse orientation and the use of protective barriers.
- Understanding the annual wind speed patterns, from lows of 2 fpm to highs of 22 fpm, helps in determining the optimal orientation of the greenhouse.
- Windbreaks (such as hedges or barriers) can be used to moderate wind speeds, protecting the structure and maintaining a stable microclimate inside the greenhouse.
APPLICATION TO GREENHOUSE DESIGN
The Application to Greenhouse Design section translates the insights from the Wind Velocity Range Chart into actionable strategies for optimizing greenhouse operations. By leveraging data on wind speed variations, the project can enhance natural ventilation, ensure structural stability, and create a sustainable growing environment. Below are the key applications:
NATURAL VENTILATION STRATEGIES
The Natural Ventilation Strategies application focuses on harnessing wind energy to reduce reliance on mechanical systems while addressing seasonal variations.
- Design the greenhouse with openings that can be adjusted to harness wind energy for ventilation during peak wind periods of 12-13 fpm in April and May. This can significantly reduce the reliance on mechanical systems during these naturally ventilated periods
- Supplemental ventilation may be needed during low wind periods of 2-7 fpm in January and February to maintain adequate airflow and prevent heat build-up.
STRUCTURAL REINFORCEMENT
The Structural Reinforcement application emphasizes the need for a robust greenhouse design to withstand peak wind speeds.
- The greenhouse structure should be reinforced to withstand peak wind speeds of 22 fpm shown in spring months.
- This includes securing the roof, walls, and other structural components to handle both the recorded high winds and the average wind speeds of 6-10 fpm throughout most of the year.
USE OF WINDBREAKS
The Use of Windbreaks application explores how natural or artificial barriers can moderate wind speeds to protect the greenhouse.
- Implement windbreaks around the greenhouse to moderate wind speeds that range from 2-22 fpm annually.
- These can be natural (trees and shrubs) or artificial (fences and barriers) and should be placed strategically to protect against the highest recorded winds while still allowing beneficial ventilation during moderate conditions.
OPTIMIZING GREENHOUSE ORIENTATION
The Optimizing Greenhouse Orientation application highlights the importance of aligning the greenhouse to maximize natural ventilation while minimizing structural risks.
- Orient the greenhouse to utilize moderate wind speeds of 6-10 fpm for natural ventilation while protecting against peak winds of 22 fpm to prevent potential structural damage.
- Consider seasonal variations showing stronger winds in spring (March-May) and moderate winds in summer months.
THE DRY BULB x RELATIVE HUMIDITY CHART
This chart provides a detailed view of the relationship between dry-bulb temperature (DBT) and relative humidity (RH) throughout the day, for each month of the year. Understanding this relationship is crucial for managing the greenhouse climate, as it directly affects plant growth, water usage, and energy consumption.
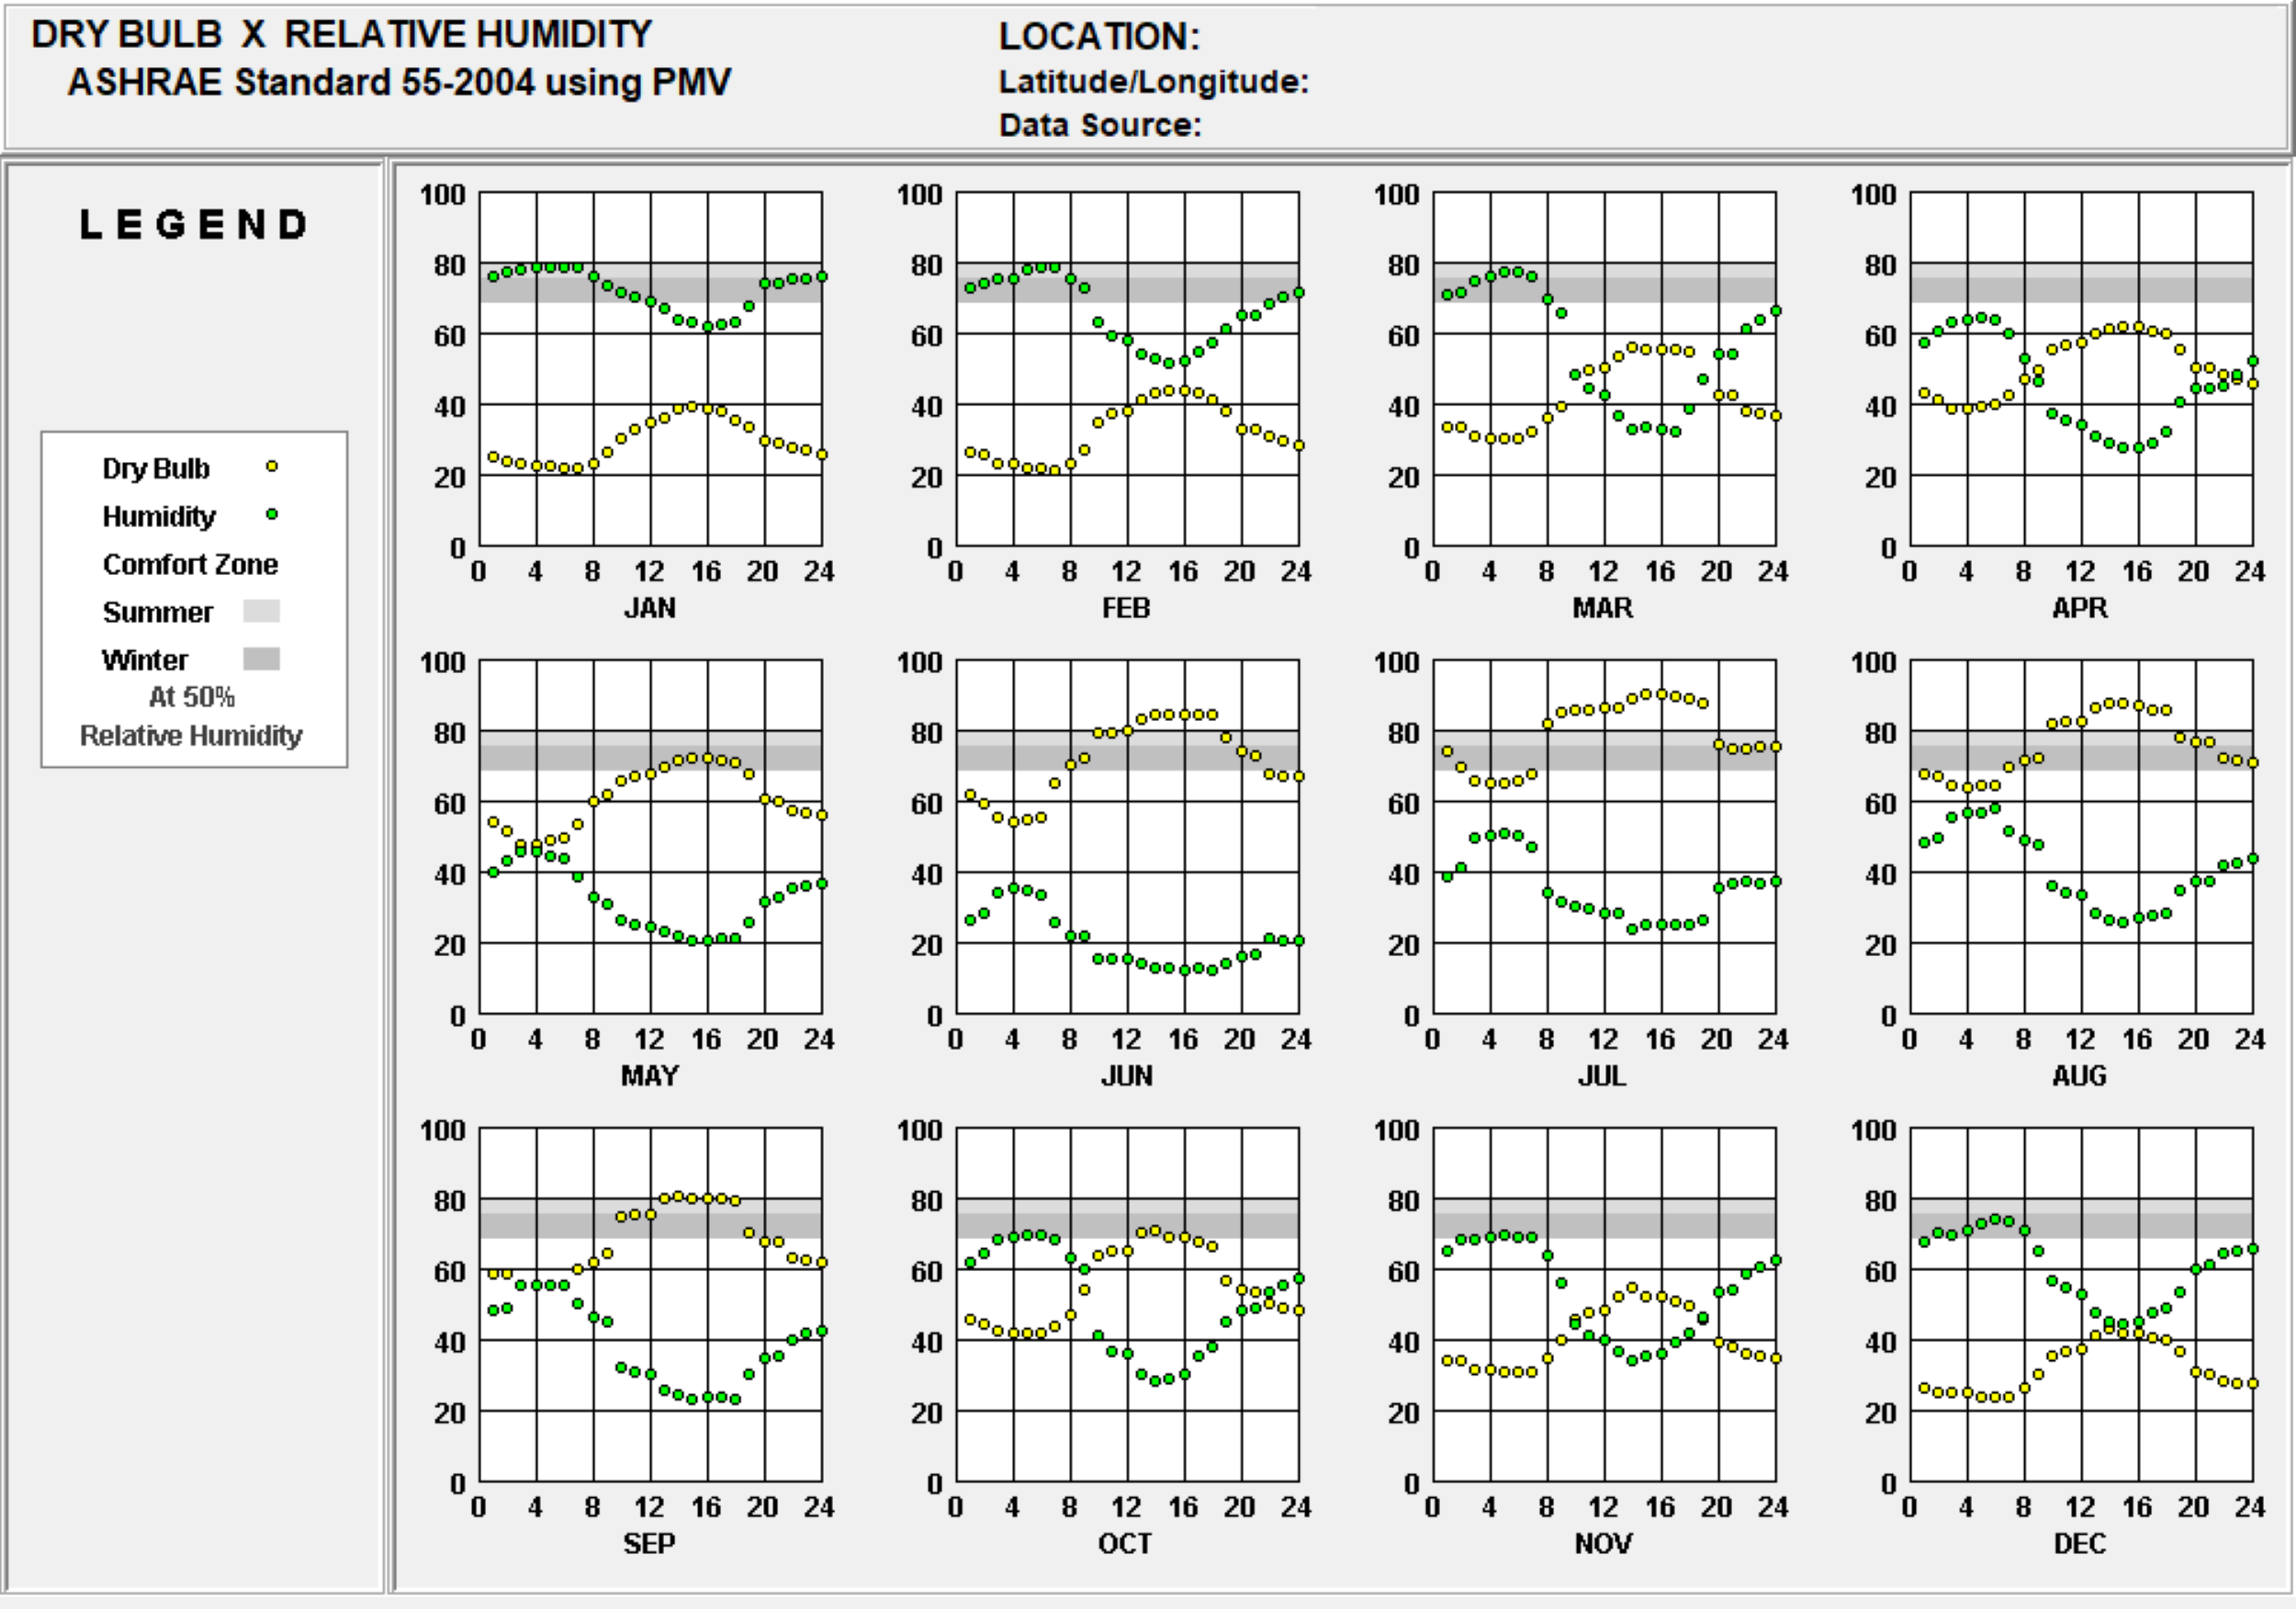
Dry bulb temperature vs. relative humidity chart analyzing thermal comfort and humidity control for climate optimization – Click to enlarge
Note – The project site is located at a higher altitude compared with the weather station data so the site may experience:
- Temperatures approximately 3.9°F cooler
- Lower relative humidity levels, particularly during peak afternoon hours
- More extreme temperature and humidity fluctuations
- Faster evaporation rates due to lower air pressure
KEY INSIGHTS
The Key Insights section breaks down the critical observations from the Dry Bulb x Relative Humidity Chart, focusing on how temperature and humidity patterns can inform greenhouse design and operational strategies. Below are the key insights:
MONTHLY TEMPERATURE AND HUMIDITY PATTERNS
The Monthly Temperature and Humidity Patterns section highlights the seasonal variations in temperature and humidity and their implications for greenhouse climate control.
- Winter Months (December to February): Temperatures range from 20-40°F, while humidity fluctuates between 60-80%. The highest humidity levels occur during early morning hours, dropping to 40-60% during midday. The comfort zone (shown in gray) is not achieved during these months, indicating the need for additional heating and humidity control measures.
- Spring and Autumn (March to May and September to November): Temperatures vary from 30-70°F with humidity ranging from 20-70%. Morning humidity peaks at 60-70%, dropping to 20-30% during afternoon hours. The greenhouse environment can leverage these more moderate conditions./li>
- Summer Months (June to August): Temperatures reach 70-85°F, with humidity levels dropping from 60% in early morning to 15-20% during peak afternoon hours. This significant drop in humidity during hot periods could lead to increased water stress for plants.
DIURNAL VARIATIONS
The Diurnal Variations section explores the daily fluctuations in temperature and humidity and their impact on greenhouse conditions.
- The chart highlights the typical daily cycle, with temperature peaking in the early afternoon and humidity reaching its lowest during these times.
- These fluctuations need to be addressed in the greenhouse design to ensure stable conditions for plant health. Automated shading and ventilation systems could help in moderating these diurnal swings.
COMFORT ZONE ANALYSIS
The Comfort Zone Analysis section emphasizes the importance of maintaining optimal temperature and humidity levels for plant growth.
- The comfort zone is marked in gray, showing the overlap between optimal temperature and humidity for most plants.
- Throughout the year, this comfort zone is rarely achieved without intervention, underscoring the importance of an efficient HVAC system to regulate both temperature and humidity.
APPLICATION TO GREENHOUSE DESIGN
The Application to Greenhouse Design section translates the insights from the Dry Bulb x Relative Humidity Chart into actionable strategies for optimizing greenhouse operations. By addressing climate control, heating and cooling needs, water usage, and energy efficiency, the project can create a sustainable and efficient growing environment. Below are the key applications:
CLIMATE CONTROL
The Climate Control application focuses on managing daily variations in temperature and humidity to maintain optimal growing conditions.
- Given the daily variations shown in the chart, with humidity fluctuating from 80% to 20% and temperatures varying by 20-30°F within a single day, a responsive climate control system is necessary.
- This could include automated ventilation, triggered when humidity drops below 30% between 12-16 hours, and misting systems when afternoon temperatures peak and humidity drops to 20-25%.
HEATING AND COOLING NEEDS
The Heating and Cooling Needs application addresses the seasonal requirements for temperature regulation.
- During winter months (December-February), heating will be required to raise temperatures from 20-40°F to the comfort zone (70-75°F).
- In summer (June-August), when temperatures reach 70-85°F and humidity drops to 15-20% during peak hours (12-16), cooling and humidity management become crucial. The data suggests that systems must manage these significant diurnal swings.
WATER USAGE AND IRRIGATION
The Water Usage and Irrigation application highlights the importance of efficient water management to address low humidity levels.
- The consistently low humidity levels during peak afternoon hours (dropping to 15-20% in summer months between 12-16 hours) indicate the need for increased irrigation.
- Morning hours exhibit higher humidity levels (60-80%), indicating that this is the optimal time for irrigation to minimize water loss through evaporation.
ENERGY EFFICIENCY STRATEGIES
The Energy Efficiency Strategies application explores ways to stabilize the internal environment and reduce energy consumption.
- With temperature variations of 20-30°F within a single day and humidity swings from 80% to 20%, thermal mass and energy-efficient glazing could help stabilize the internal environment.
- The chart shows that early morning hours (0-6) consistently maintain higher humidity (60-80%) and lower temperatures, suggesting potential for night-time cooling strategies.
DRY BULB x DEW POINT ANALYSIS
The Dry Bulb vs. Dew Point chart provides a detailed view of how temperature and dew point values vary throughout the day and across different months. Each graph represents the hourly variations for a specific month, showing the dry bulb temperature (air temperature) and the dew point temperature (the temperature at which air becomes saturated and water vapor condenses). Understanding these variations is crucial for managing the internal climate of the greenhouse, particularly in controlling humidity levels to optimize plant growth conditions.
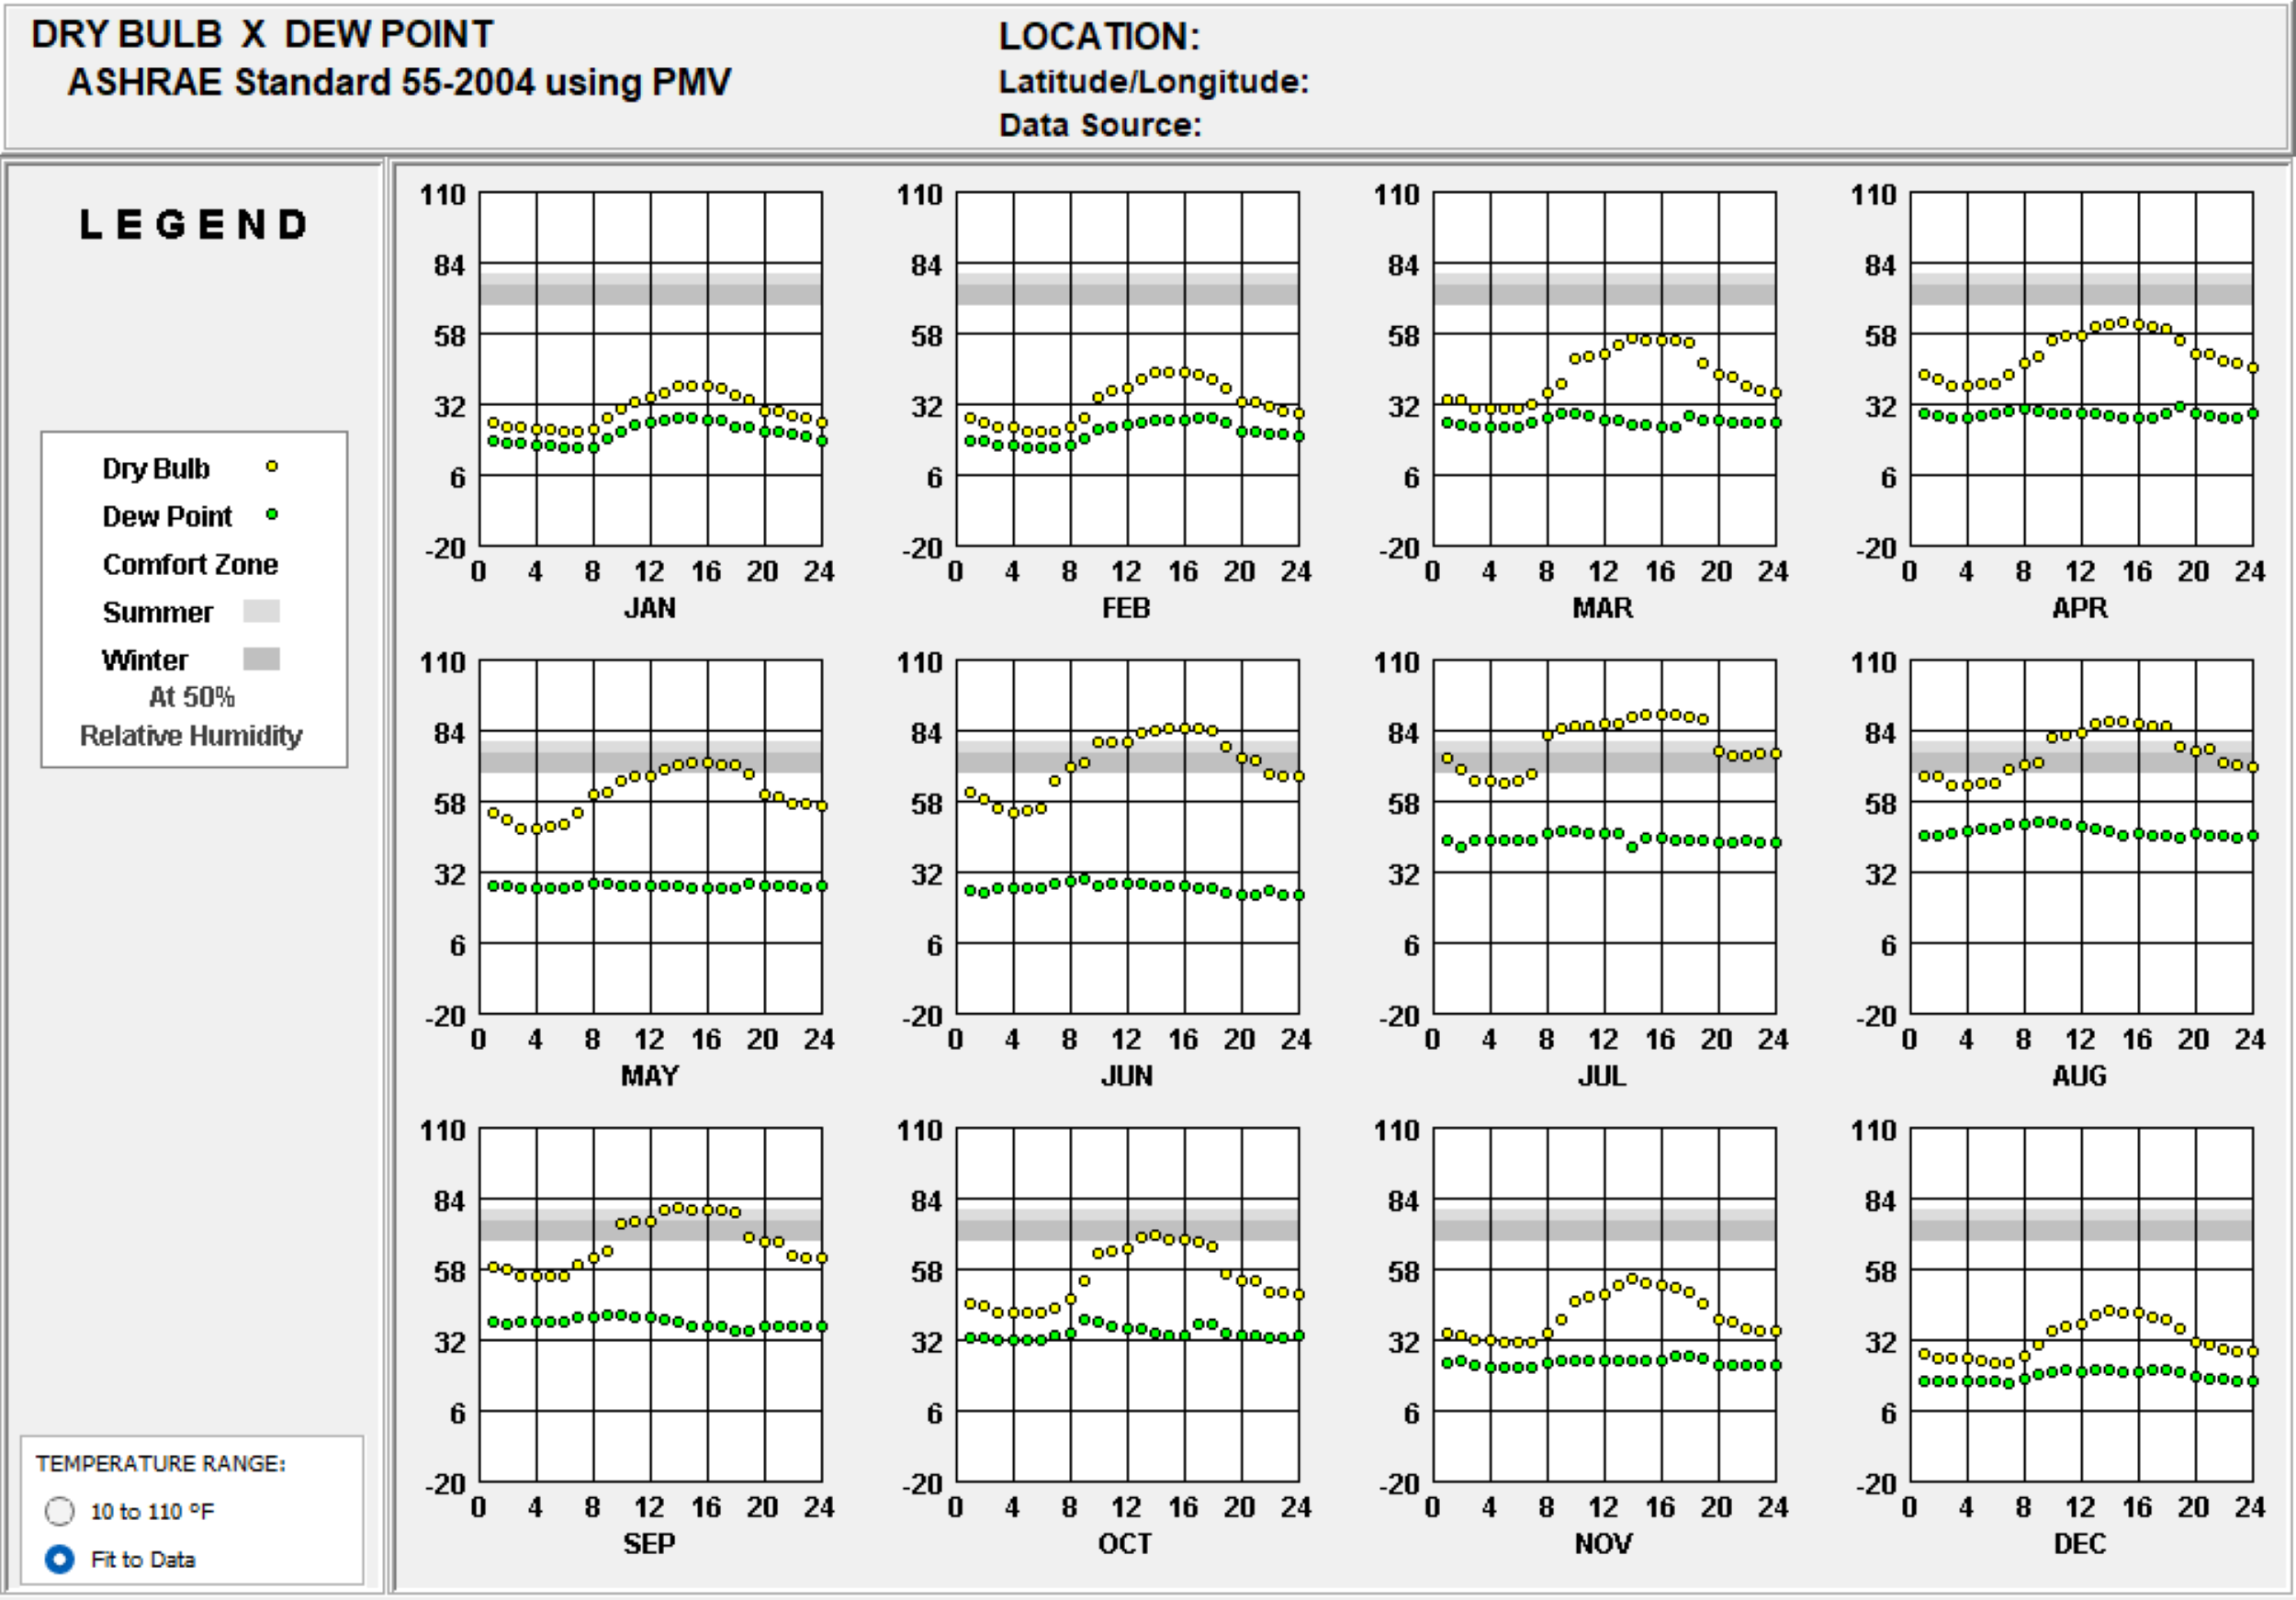
Dry bulb temperature vs. dew point chart analyzing humidity levels and condensation risks for climate control – Click to enlarge
Note – The project site is located at a higher altitude compared with the weather station data so the site may experience:
- Dry bulb temperatures approximately 4°F cooler
- Lower dew point temperatures due to reduced atmospheric moisture
- Larger gaps between dry bulb and dew point temperatures
- More extreme diurnal temperature variations
- Reduced condensation risk due to drier air conditions
KEY INSIGHTS
The Key Insights section breaks down the critical observations from the Dry Bulb vs. Dew Point Chart, focusing on temperature patterns, comfort zone implications, humidity control, and condensation risk management. Below are the key insights:
MONTHLY TEMPERATURE PATTERNS
The Monthly Temperature Patterns section highlights the variations in dry bulb and dew point temperatures across seasons.
- The dry bulb temperature (yellow dots) shows daily fluctuations of 20-30°F, with winter months ranging from 20-40°F and summer months reaching 70-85°F.
- Dew point temperatures (green dots) remain more stable, typically varying by only 5-10°F throughout the day, staying between 20-45°F depending on the season.
COMFORT ZONE IMPLICATIONS
The Comfort Zone Implications section examines how natural conditions align with the optimal temperature range for plant growth.
- The comfort zone (grey band at approximately 70-75°F) shows that natural conditions rarely fall within the optimal range without intervention.
- Winter months (December-February) show temperatures consistently 30-40°F below the comfort zone, while summer months (June-August) approach or reach it during peak daytime hours.
HUMIDITY CONTROL
The Humidity Control section explores the relationship between dry bulb and dew point temperatures and its impact on humidity levels.
- The gap between dry bulb and dew point temperatures is largest during summer afternoons (30-40°F difference), indicating very dry conditions.
- Morning hours typically show the smallest gap between dry bulb and dew point (5-10°F difference), suggesting higher relative humidity and potential condensation risk.
- July and August show the highest dew point temperatures (around 45°F), while winter months show the lowest (around 20°F).
CONDENSATION RISK MANAGEMENT
The Condensation Risk Management section identifies periods of high and low condensation risk based on temperature and dew point data.>
- Highest condensation risk occurs in early morning hours (0-6) when dry bulb temperatures approach dew point temperatures, particularly in winter months.
- Summer months show reduced condensation risk during daytime hours due to the large separation between dry bulb and dew point temperatures (30-40°F difference).
- Spring and fall months show moderate risk patterns with daily temperature variations of 20-25°F
APPLICATION TO GREENHOUSE DESIGN
The Application to Greenhouse Design section translates the insights from the Dry Bulb vs. Dew Point Chart into actionable strategies for optimizing greenhouse operations. By addressing temperature control, plant health, ventilation, and seasonal adjustments, the project can create a sustainable and efficient growing environment. Below are the key applications:
TEMPERATURE CONTROL STRATEGIES
The Temperature Control Strategies application focuses on maintaining stable temperatures and managing humidity levels.
- Utilize the dry bulb temperature data showing daily fluctuations from 20-40°F in winter and 70-85°F in summer to design heating systems that can maintain stable temperatures, particularly during nighttime drops of 20-30°F.
- Dew point data ranging from 20°F in winter to 45°F in summer helps plan dehumidification strategies, especially during early morning hours (0-6) when dry bulb temperatures approach dew point temperatures.
OPTIMIZING PLANT HEALTH
The Optimizing Plant Health application emphasizes creating tailored growing zones based on temperature and humidity data.
- Use the data showing summer dry bulb peaks of 80-85°F with dew points around 45°F to establish appropriate temperature and humidity zones.
- For example, plants with high humidity tolerance can be placed in morning zones where the gap between dry bulb and dew point is smallest (5-10°F difference).
VENTILATION AND AIRFLOW DESIGN
The Optimizing Plant Health application emphasizes creating tailored growing zones based on temperature and humidity data. The chart shows critical ventilation needs during:
- Early morning hours when dry bulb and dew point temperatures are closest (5-10°F gap).
- Summer afternoons when dry bulb temperatures peak at 80-85°F
- Winter mornings when condensation risk is highest due to low temperatures (20-30°F).
SEASONAL ADJUSTMENTS
The Seasonal Adjustments application highlights the need for adaptive strategies to address seasonal temperature variations. Plan modifications based on:
- Winter months (December-February): Dry bulb temperatures of 20-40°F requiring significant heating.
- Summer months (June-August): Peak temperatures of 70-85°F needing cooling strategies.
- Spring/Fall transition periods: Moderate temperatures but larger daily fluctuations requiring flexible control systems.
ANALYSIS OF THE WIND WHEEL CHART
The Wind Wheel chart offers an in-depth view of wind patterns, showing how wind speed and direction vary over the course of the year. The colors and patterns in the chart represent key data points like temperature and relative humidity, providing essential insights into how these factors interact with wind at different times of the day and in various seasons.
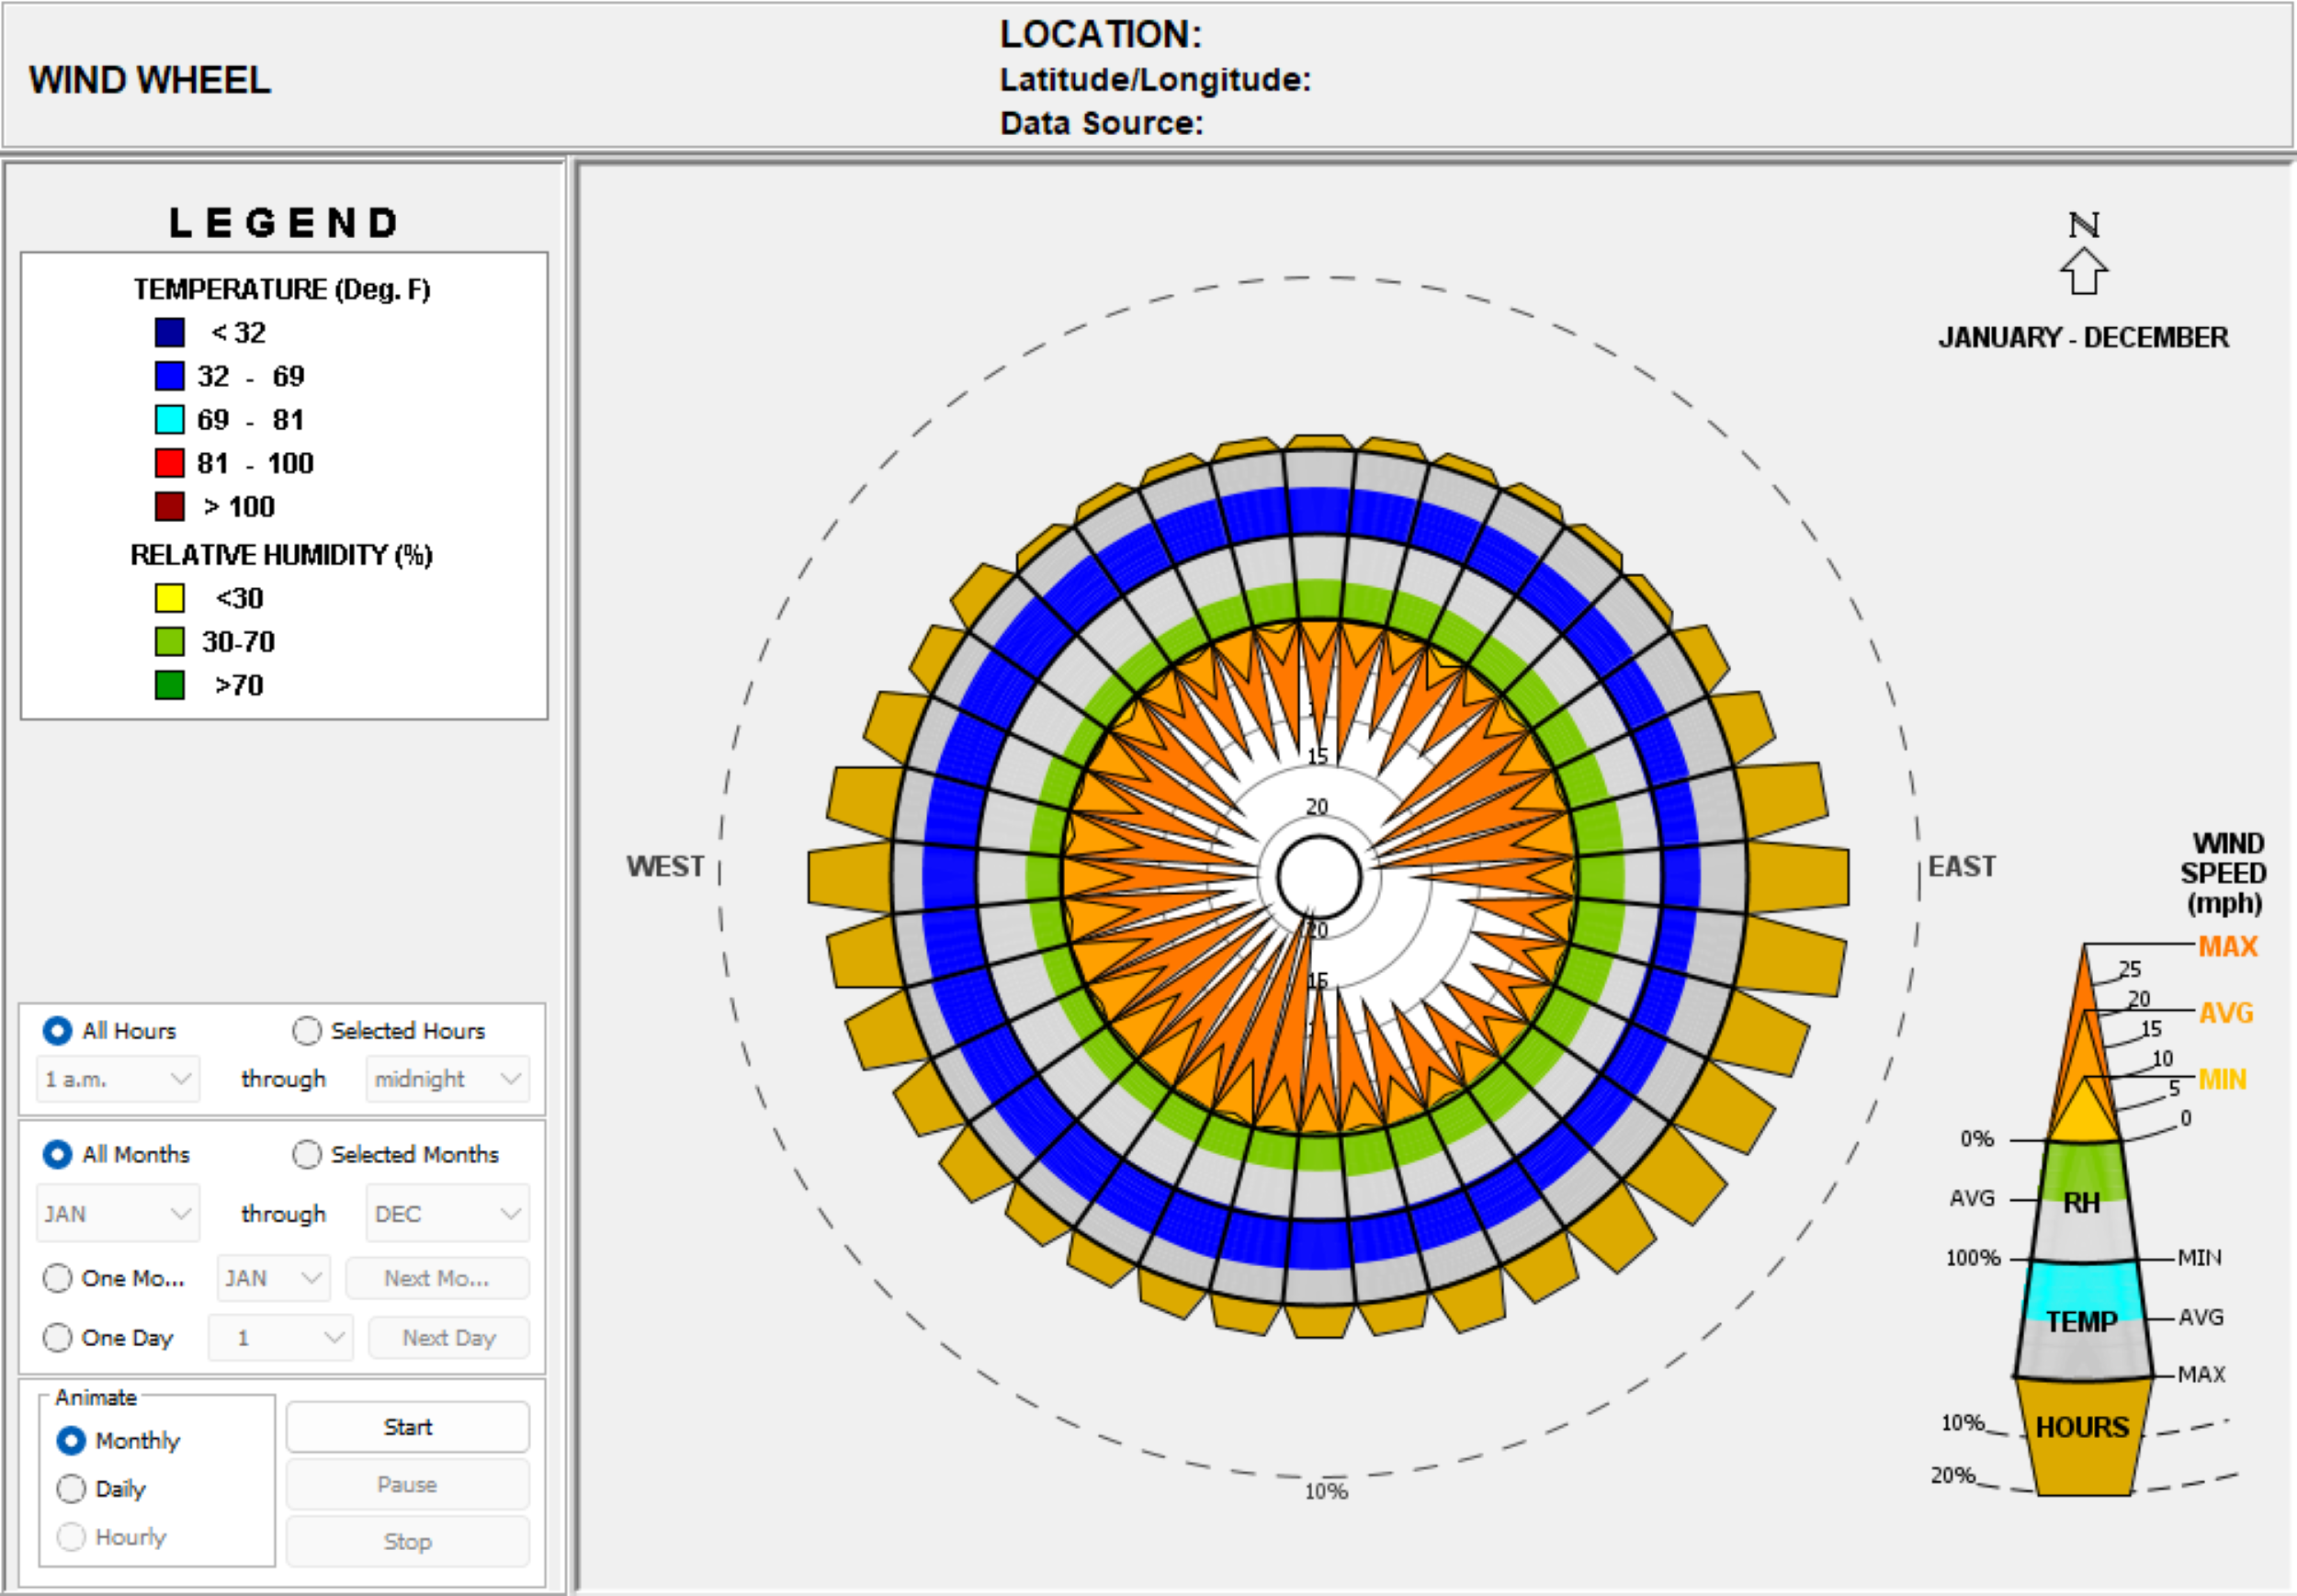
Wind wheel chart showing annual wind direction and speed patterns for optimizing ventilation and airflow – Click to enlarge
Note – The project site is located at a higher altitude compared with the weather station data so the site may experience:
- Stronger wind velocities due to reduced air density
- Different wind patterns due to local topography
- More turbulent air flow conditions
- Modified temperature and humidity correlations with wind direction
KEY INSIGHTS
The Key Insights section breaks down the critical observations from the Wind Wheel Chart, focusing on wind speed and direction, temperature and humidity influence, humidity correlation, and the analysis of all hours and selected months. Below are the key insights:
WIND SPEED AND DIRECTION
The Wind Speed and Direction section highlights the predominant wind patterns and their implications for greenhouse design.
- The wind wheel shows speeds from 0-25 mph with predominant winds from the southwest and west directions. The outer ring shows temperature ranges (<32°F in blue, 32-69°F in light blue, 69-81°F in cyan, 81-100°F in orange).
- Application to Greenhouse: Understanding that the strongest winds come from the South-Southwest direction helps inform ventilation opening placement and structural reinforcement. The temperature overlay shows cold winds (<32°F) primarily from the North, which requires protection strategies for the greenhouse’s northern exposure.
TEMPERATURE AND HUMIDITY INFLUENCE
The Temperature and Humidity Influence section explores how wind interacts with temperature and humidity to affect the greenhouse environment.
- The chart also overlays temperature ranges, represented in blue for colder temperatures and red for warmer temperatures. This information is helpful to predict how wind may cool or heat the environment based on seasonal patterns.
- Application to Greenhouse: During colder months, the combination of strong winds and low temperatures from specific directions might cause a rapid loss of heat in the greenhouse. On the other hand, in summer, the wind can help cool the greenhouse naturally. You can design around these seasonal wind effects to either protect against cold or enhance passive cooling strategies.
HUMIDITY CORRELATION
The Humidity Correlation section examines how wind speed and direction interact with humidity levels.
The relative humidity overlay shows:
- Low humidity (<30%) in yellow
- Moderate humidity (30-70%) in green
- High humidity (>70%) in darker green
Application to Greenhouse: During periods of high humidity combined with lower wind speeds, there could be a risk of poor air circulation, leading to humidity buildup in the greenhouse, which may affect plant health. In contrast, higher wind speeds with lower humidity can help regulate moisture levels and prevent fungal growth or other humidity-related issues. Understanding this allows you to adjust humidity control systems accordingly, especially during the growing season.
ALL HOURS / SELECTED HOURS & MONTHS
The All Hours / Selected Hours & Months section analyzes the annual and specific time-based wind patterns.
- The chart represents annual data for all hours (as indicated by the selected “All Hours” and “All Months” options), showing the complete wind pattern distribution throughout the year.
- Application to Greenhouse: By analyzing the wind patterns at specific times of the day, you can optimize the operational hours for active ventilation, reducing the reliance on mechanical systems. During low-wind periods, you can increase mechanical ventilation, while in high-wind periods, natural ventilation will be more efficient.
DESIGN GUIDELINES
Effective design guidelines are essential for creating energy-efficient and comfortable spaces in the greenhouse environment of Walipini 1. These guidelines encompass strategies for passive solar heating, high-performance glazing, thermal mass utilization, and climate-responsive construction. By integrating these elements, the greenhouse can optimize heat retention, minimize energy usage, and provide a conducive environment for plant growth throughout the year. The following recommendations provide a comprehensive approach to achieving these objectives, emphasizing the use of natural resources and innovative design principles to enhance overall sustainability and functionality.
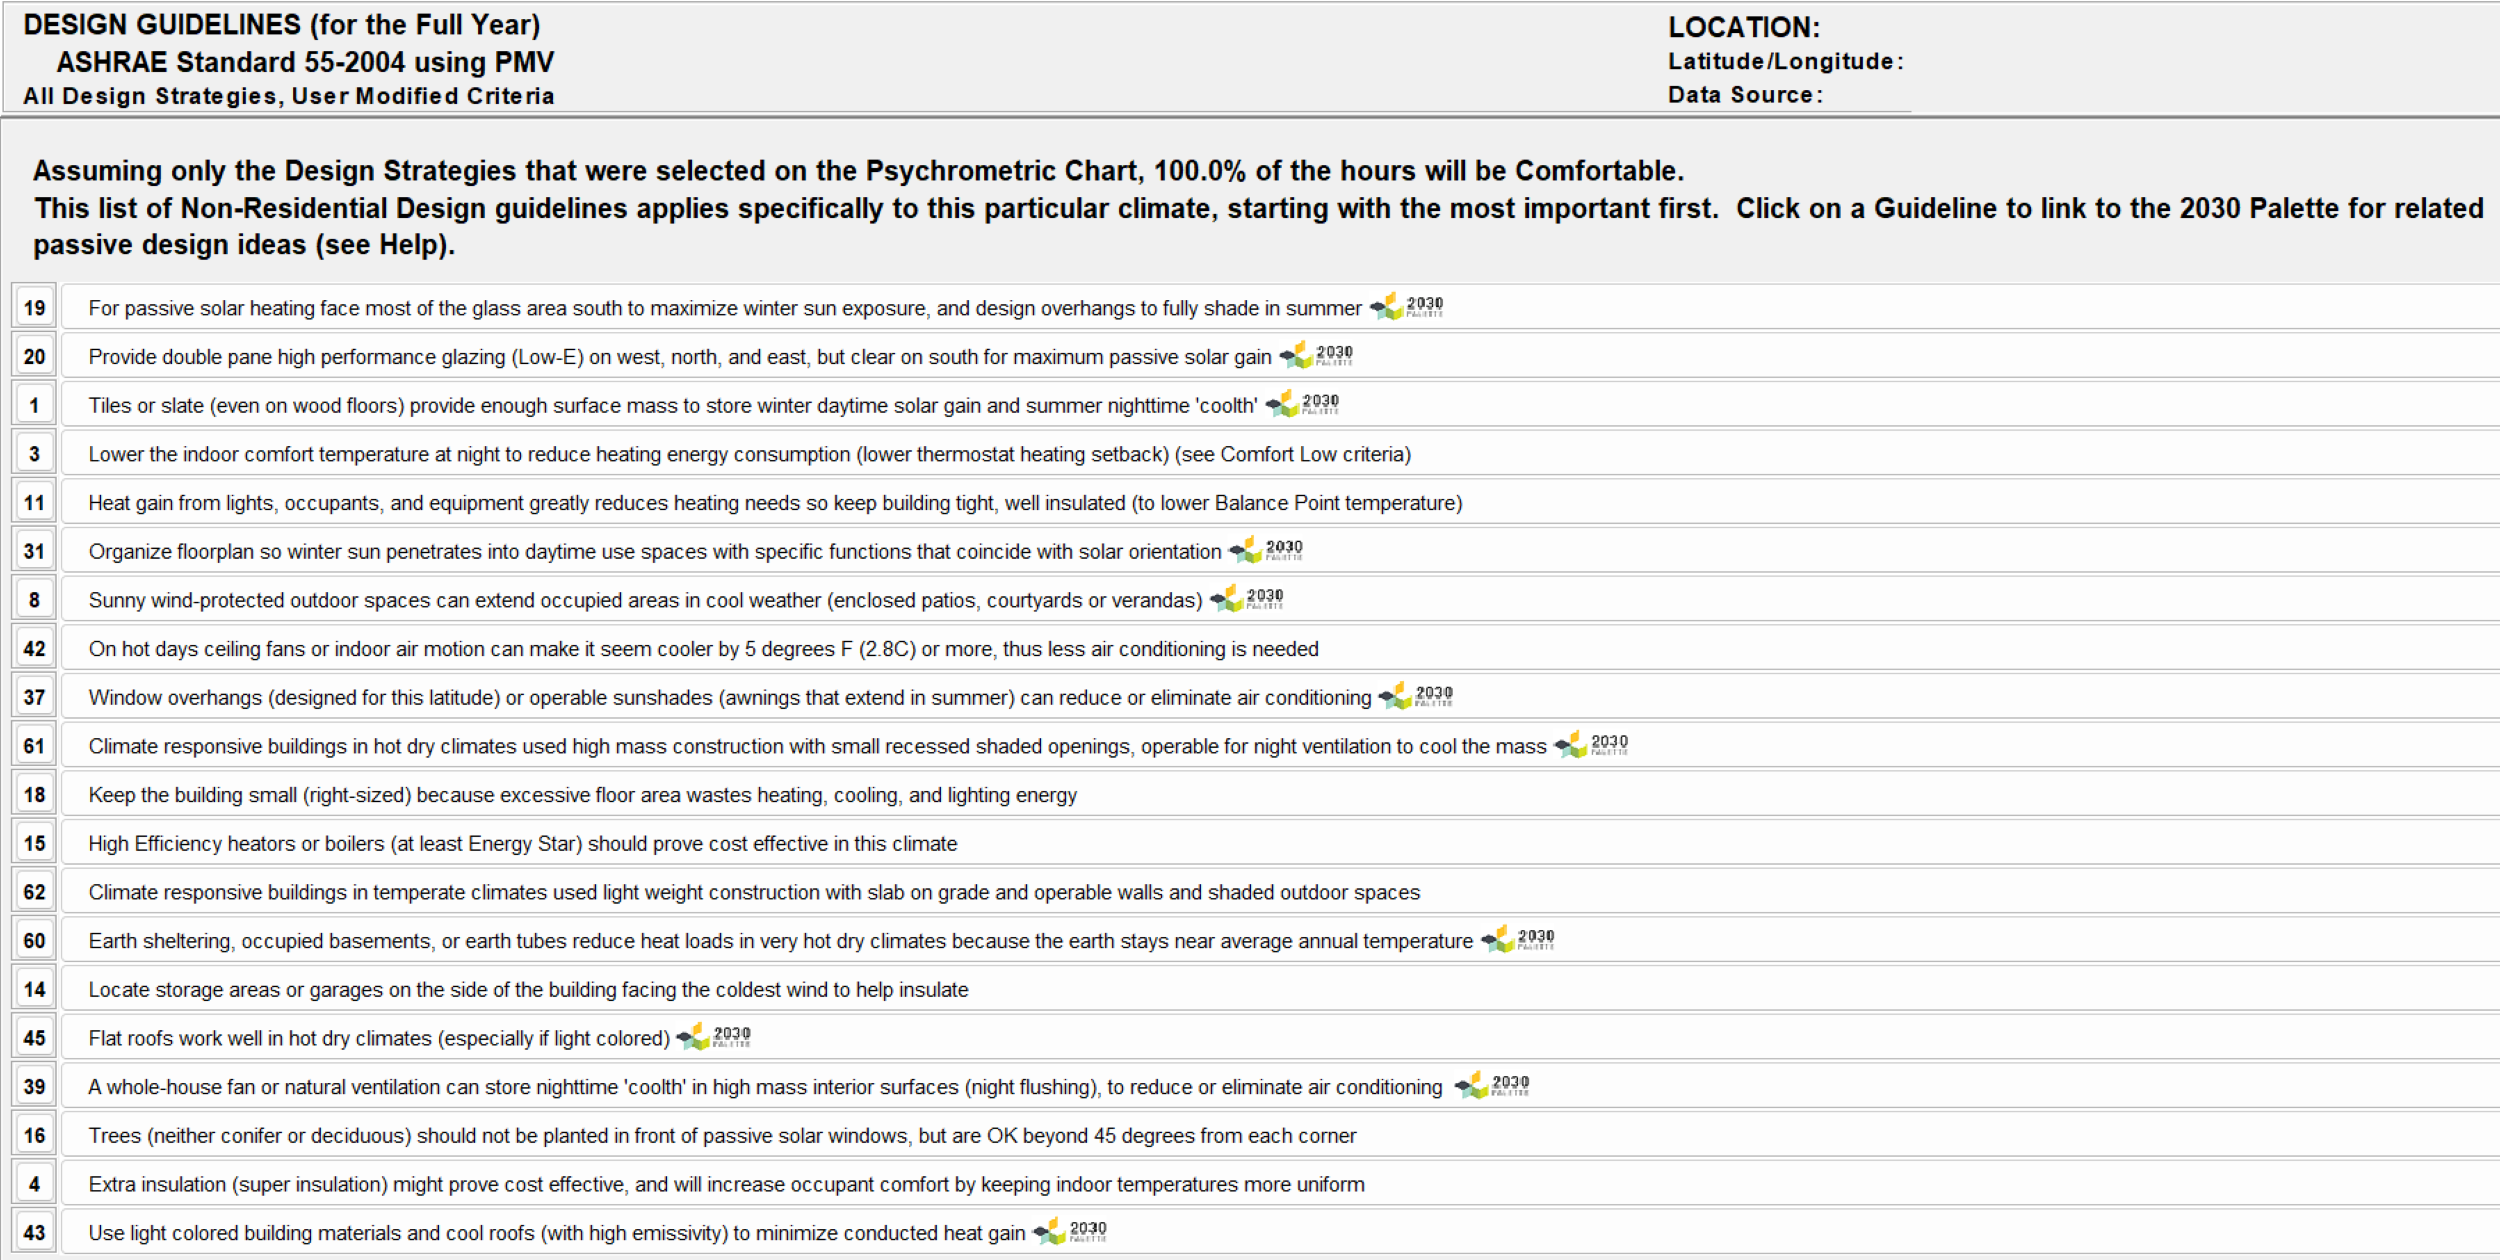
ASHRAE design guidelines for passive solar heating, ventilation, and energy-efficient greenhouse strategies – Click to enlarge
Note – The project site is located at a higher altitude compared with the weather station data so the site may experience:
- More intense direct solar radiation requiring adjusted overhang depths
- Greater temperature fluctuations affecting thermal mass performance
- Modified shading requirements due to clearer atmosphere
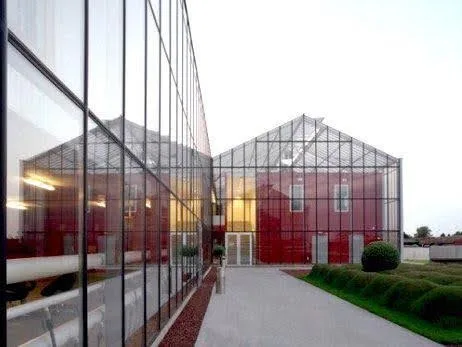
- Different solar gain patterns requiring adapted glazing strategie
The numbers shown in the leftmost column of the design guidelines chart are not random – they are priority numbers or guideline identifiers for different passive design strategies.
The guidelines are arranged in order of importance for this specific climate zone, with lower numbers generally indicating higher priority strategies.The numbers serve as reference points that can be used to link to more detailed information about each strategy in the design software’s 2030 Palette.
PASSIVE SOLAR HEATING
The Passive Solar Heating section outlines strategies to maximize solar energy capture and retention, ensuring efficient heating during colder months.
ORIENTATION AND GLAZING PLACEMENT
The Orientation and Glazing Placement section focuses on optimizing the greenhouse’s alignment and glazing to maximize solar gain during winter months.
- To maximize winter sun exposure and harness solar energy efficiently, most of the glazing should be oriented toward true south (guideline #19).
- The glass area should be within 15º of true south and not more than 25º off this axis.
- Double pane high-performance glazing (Low-E) should be used on west, north, and east faces, while keeping south glazing clear for maximum passive solar gain (guideline #20). This allows for optimal sunlight penetration during colder months.
GLAZING DESIGN FOR SEASONAL EFFICIENCY
The Glazing Design for Seasonal Efficiency section highlights the importance of designing glazing systems to balance solar gain in winter and prevent overheating in summer.
- Solar glazing must be designed to admit direct sunlight in winter for passive heating.
- Window overhangs should be specifically designed for this latitude (36.96° North) or use operable sunshades (awnings that extend in summer) to prevent overheating (guideline #37).
- Movable insulation can be applied to glazing at night in very cold climates to minimize heat loss and keep internal temperatures more stable during colder nights.”
THERMAL MASS FOR HEAT RETENTION
The Thermal Mass for Heat Retention section explores how materials with high thermal mass can store and release heat to stabilize indoor temperatures.
- Tiles or slate (even on wood floors) provide enough surface mass to store winter daytime solar gain and summer nighttime ‘coolth’ (guideline #1).
- In hot dry climates, high mass construction with small recessed shaded openings should be used, operable for night ventilation to cool the mass (guideline #61). This stored energy can then be released during the night, reducing the need for additional heating.
SIZING SOLAR GLAZING
The Sizing Solar Glazing section provides recommendations for determining the appropriate amount of glazing based on climate and latitude.
Based on the location and climate, solar glazing should be appropriately sized as a percentage of the floor area. For example:
In cold climates, solar glazing should cover:
- 16% of the floor area at 28º – 40º latitude.
- 20% of the floor area at 44º – 56º latitude.
In temperate climates, the coverage should be:
- 10% of the floor area at 28º – 40º latitude.
- 13% of the floor area at 44º – 56º latitude.
OVERHANGS AND SHADING DESIGN
The Overhangs and Shading Design section emphasizes the importance of shading devices in managing solar gain and preventing overheating.
- To optimize comfort throughout the year, overhangs and sunshades should be tailored based on the latitude and the glazing used.
- During the summer, shading devices will reduce overheating, especially when the sun is high in the sky, while in the winter, they should allow maximum solar penetration to capture heat.
- The design of these overhangs should take into account the solar angles during different times of the year.
HIGH-PERFORMANCE GLAZING
The High-Performance Glazing section focuses on optimizing the greenhouse’s glazing system to balance energy efficiency and solar gain. By selecting the right glazing materials and configurations, the greenhouse can maximize passive solar heating while minimizing heat loss.
GLAZING STRATEGY
The Glazing Strategy section outlines the recommended approach for glazing placement and material selection.
- Use double-pane, low-emissivity (Low-E) glazing on the west, north, and east faces to reduce heat loss and improve insulation.
- Keep the south-facing glazing clear to maximize passive solar gain during winter months, ensuring optimal sunlight penetration for heating and plant growth.
THERMAL MASS FOR HEAT STORAGE
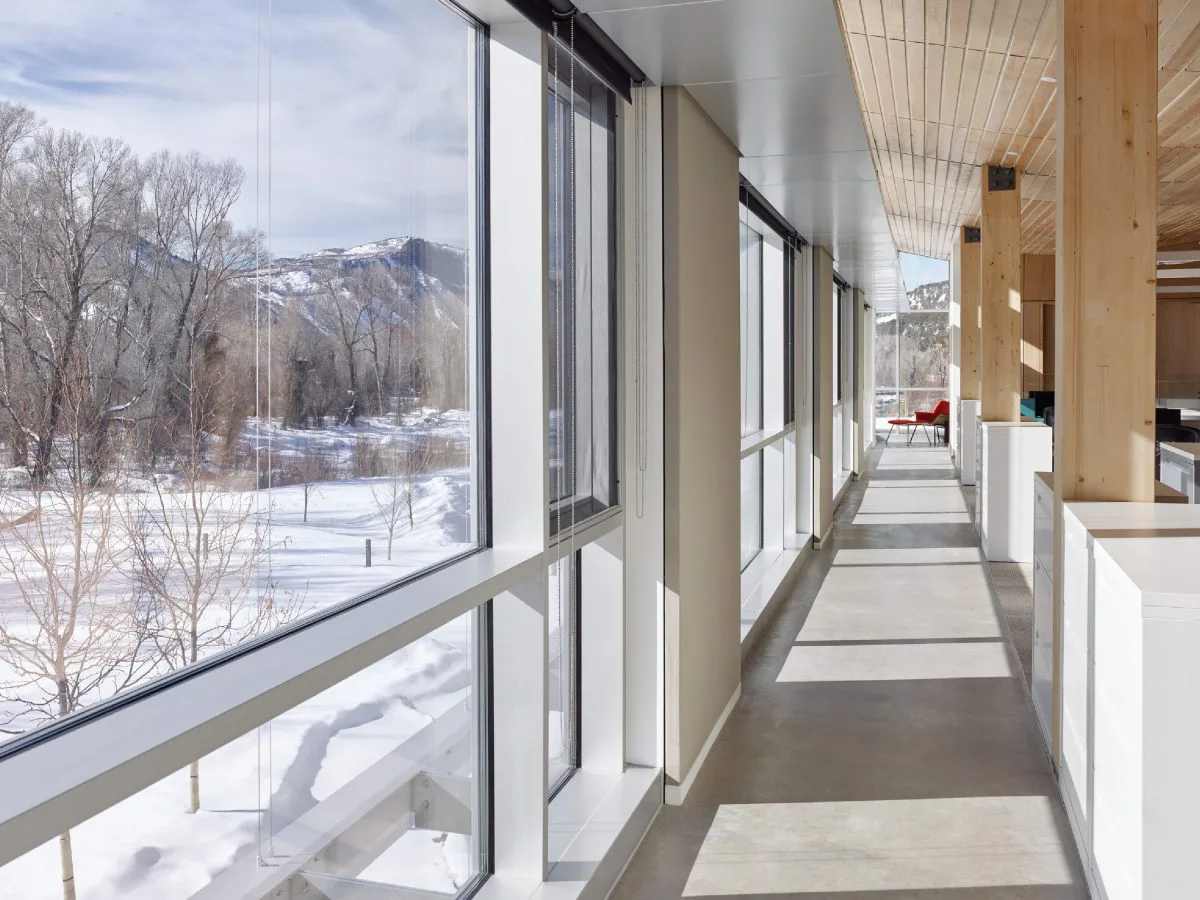
Thermal mass plays a crucial role in stabilizing the temperature within a greenhouse by absorbing excess heat during the day and releasing it during the cooler night hours. For this greenhouse project, incorporating thermal mass can be done by using materials like masonry floors, walls, or ceilings, which naturally absorb and store solar heat. Given the climate data, it’s important to ensure that the thermal mass is optimized for the specific temperature fluctuations at the project site.
ENHANCING THERMAL MASS FOR GREENHOUSE USE
The Enhancing Thermal Mass for Greenhouse Use section provides detailed recommendations for selecting, sizing, and positioning thermal mass materials to maximize their effectiveness in stabilizing the greenhouse environment.
MATERIALS:
The Materials section highlights the types of materials best suited for thermal mass in a greenhouse setting.
- Use masonry materials like concrete, brick, or stone for floors and lower walls. These materials have high heat retention properties and will store solar heat during the day, releasing it at night to help maintain a stable internal environment.
- Since greenhouses are primarily designed for plant growth, ensure that these materials are placed strategically, avoiding areas where plant roots may be affected by temperature changes.
THICKNESS & RATIO:
The Thickness & Ratio section outlines the optimal dimensions and proportions for thermal mass elements.
- To achieve effective thermal storage, aim for a minimum of 10 cm (4 inches) thickness for walls, floors, or other thermal mass elements.
- Based on the 2030 Palette guidelines, a surface area to solar glazing ratio of 3:1 to 9:1 is recommended. This ratio is crucial because it ensures a balance between heat gain during the day and heat release at night.
- For this greenhouse project, it’s advisable to stay on the higher end of the ratio spectrum (closer to 9:1), as this will better stabilize the indoor temperature, especially when outdoor temperatures fluctuate significantly between day and night.
COLOR & SURFACE TREATMENT:
The Color & Surface Treatment section explains how color choices can optimize heat absorption and reflection.
- In a greenhouse environment, use medium to dark colors for floors to maximize heat absorption.
- Ceilings and lightweight construction should be lighter in color to reflect excess sunlight and prevent overheating.
- This balance helps optimize the solar heat absorption and ensures the thermal mass effectively supports the greenhouse’s temperature needs.
EXTERNAL WALLS:
The External Walls section discusses how to integrate thermal mass into the greenhouse’s exterior design.
- If the greenhouse incorporates masonry external walls, ensure that insulation is placed on the outer side of these walls. This will keep the masonry exposed to the interior, enhancing heat retention and release.
- By insulating the exterior, you minimize heat loss to the environment, ensuring the thermal mass continues to work effectively within the greenhouse space.
SPECIFIC TO GREENHOUSE DESIGN
The Specific to Greenhouse Design section emphasizes the unique considerations for using thermal mass in a greenhouse setting.
- In the case of a greenhouse, thermal mass also helps mitigate extreme temperatures that can harm plants. It ensures that the greenhouse doesn’t overheat during the day and remains warm at night, providing a stable environment for optimal plant growth.
- Positioning thermal mass materials close to where plants are growing, but not directly in their root zones, allows for better control of air temperature without affecting soil temperature too drastically.
LOWER INDOOR COMFORT TEMPERATURE AT NIGHT
The Lower Indoor Comfort Temperature at Night section emphasizes the importance of adjusting nighttime temperatures to improve energy efficiency.
- Lower the indoor comfort temperature at night to reduce heating energy consumption. This can be achieved by implementing a lower thermostat heating setback during nighttime hours.
- This strategy helps conserve energy while still maintaining a stable environment for plant growth.
HEAT GAIN FROM INTERNAL SOURCES
The Heat Gain from Internal Sources section explores how internal heat sources can be leveraged to reduce heating demands.
- Heat gain from lights, occupants, and equipment can significantly reduce heating needs.
- To maximize this benefit, ensure the building is tight and well-insulated, which lowers the Balance Point Temperature (the outdoor temperature at which no heating is required).
- This approach minimizes heat loss and optimizes the use of internal heat sources to maintain a comfortable indoor environment.
OPTIMIZED FLOOR PLAN FOR SUN PENETRATION
The Optimized Floor Plan for Sun Penetration section provides strategies to maximize natural sunlight exposure within the greenhouse, ensuring efficient passive solar heating and optimal plant growth. By carefully considering building orientation, zone placement, and design elements, the greenhouse can achieve even light distribution and reduce reliance on artificial lighting.
BUILDING ORIENTATION FOR MAXIMUM SUNLIGHT EXPOSURE
The Building Orientation for Maximum Sunlight Exposure section highlights the importance of aligning the greenhouse to capture the most sunlight.
- To ensure maximum sun penetration into the greenhouse, elongate the structure along the east-west axis.
- This layout increases the surface area exposed to the low winter sun, which strikes the solar side (south in the Northern Hemisphere).
- This design allows more direct sunlight to enter the greenhouse, especially during colder months when passive solar heating is most needed.
PLACEMENT OF CRITICAL GREENHOUSE ZONES
The Placement of Critical Greenhouse Zones section focuses on positioning light-sensitive plants to maximize their exposure to sunlight.
- Place areas where light-sensitive plants grow along the solar side of the structure (the side facing the equator).
- This positioning helps plants that require more direct sunlight thrive, particularly during winter months.
- Stagger or align plant beds or shelving within the greenhouse to ensure plants receive adequate sunlight throughout the day.
SKYLIGHTS AND SUNSPACES FOR ADDITIONAL LIGHT
The Skylights and Sunspaces for Additional Light section explores design elements that enhance natural light penetration.
- Incorporate solar-oriented skylights or clerestories in sections of the greenhouse that may not receive direct sunlight due to orientation or shading.
- These design elements allow natural light to penetrate deeper into the greenhouse, ensuring even light distribution.
This approach is particularly useful for greenhouses where maximizing natural light penetration is essential for energy efficiency and optimal plant growth.
STACKED OR STAGGERED SPACES FOR SUN EXPOSURE
The Stacked or Staggered Spaces for Sun Exposure section discusses how multi-level designs can optimize light distribution.
- For greenhouses with multiple levels or areas, stagger or step the interior layout to ensure each space receives ample light.
- This method is especially useful for multi-tiered planting areas, as it ensures all levels receive some degree of sunlight throughout the day.
SUMMARY
By elongating the greenhouse along the east-west axis and incorporating these design strategies, sunlight will penetrate deeper into the structure, reducing the need for artificial lighting and enhancing passive solar heating.
WIND-PROTECTED OUTDOOR SPACES
To create wind-protected outdoor spaces that extend comfortable usage, particularly in colder or windier climates, the design should focus on sheltering these areas while maximizing solar exposure.
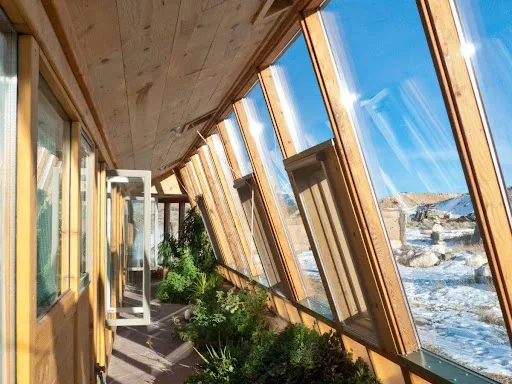
DESIGN OF WIND-PROTECTED SPACES
The Design of Wind-Protected Spaces section outlines strategies to create sheltered outdoor areas that remain comfortable and functional throughout the year.
SUNSPACE DESIGN AND INTEGRATION:
The Sunspace Design and Integration section highlights how sunspaces can provide shelter and capture solar heat.
- Incorporate a sunspace along the solar façade (south-facing side) of the greenhouse to provide shelter from the wind while capturing heat from the sun.
- This area can act as a buffer between the outdoor environment and the interior of the greenhouse.
- By placing the sunspace on the solar side, it maximizes sunlight exposure, and the warmth from the sun can be used to heat both the sunspace and the adjacent interior spaces of the greenhouse.
GLAZING FOR SUNSPACE:
The Glazing for Sunspace section provides guidelines for sizing glazing to optimize heat retention.
- In cold climates, size the sunspace glazing as 30-40% of the floor area of the adjacent space, based on the latitude.
- In temperate climates, glazing should cover 20-30% of the adjacent floor area.
- This glazing allows sunlight to enter the sunspace, heating the air and surfaces inside, which extends the usability of the space.
THERMAL MASS WALLS:
The Thermal Mass Walls section discusses the use of heat-retaining materials to stabilize temperatures.
Build the common mass wall between the sunspace and the greenhouse from materials like adobe, brick, or concrete. For instance:
- Adobe: 20-30 cm (8-12 inches) thick.
- Brick: 25-36 cm (10-14 inches) thick.
- Concrete: 30-46 cm (12-18 inches) thick.
These materials store solar heat during the day and release it slowly at night, keeping the adjacent greenhouse or outdoor areas warm.
Incorporating thermal mass extends the comfortable use of these spaces even when the outdoor temperature drops.
HEAT TRANSFER OPENINGS:
The Heat Transfer Openings section explains how to facilitate heat flow between spaces.
- Use wall openings, windows, or doors to transfer heat from the sunspace into the main greenhouse or adjacent areas.
- This reduces the heating load inside the greenhouse and extends the period of comfort in the outdoor sheltered area.
SPECIFIC TO GREENHOUSE DESIGN
The Specific to Greenhouse Design section emphasizes the benefits of wind-protected outdoor spaces in a greenhouse setting.
- Wind-protected outdoor spaces in a greenhouse setting help maintain favorable microclimates for outdoor planting beds or seating areas.
- They can also act as transitional zones between the colder outside environment and the warmer greenhouse interior, reducing heat loss when people or goods are moving in and out of the greenhouse.
SUMMARY
By applying these sunspace and thermal mass strategies, you can enhance the functionality of the greenhouse and create comfortable outdoor spaces that remain usable for a longer portion of the year, even in cold or windy climates.
CEILING FANS OR INDOOR AIR MOTION
The Ceiling Fans or Indoor Air Motion section highlights strategies to improve indoor comfort and reduce the need for air conditioning by enhancing air circulation and leveraging natural cooling methods.
GUIDELINE #42: CEILING FANS FOR COOLING
The Ceiling Fans for Cooling section explains how air motion can improve comfort and reduce energy use.
- On hot days, ceiling fans or indoor air motion can make it seem cooler by 5°F (2.8°C) or more, reducing the need for air conditioning.
- This strategy enhances comfort while lowering energy consumption.
GUIDELINE #39: NIGHT FLUSHING WITH HIGH MASS
The Night Flushing with High Mass section explores how natural ventilation and thermal mass can store nighttime coolness.
- A whole-house fan or natural ventilation can store nighttime ‘coolth’ in high-mass interior surfaces (night flushing) to reduce or eliminate the need for air conditioning.
- This approach leverages cooler nighttime temperatures to lower indoor temperatures during the day.
COMBINING STRATEGIES
The Combining Strategies section emphasizes the benefits of integrating ceiling fans and night flushing.
- Combining ceiling fans (guideline #42) with night flushing (guideline #39) can maximize cooling efficiency.
- Ceiling fans enhance daytime comfort, while night flushing cools the thermal mass, creating a synergistic effect that minimizes reliance on air conditioning.
WINDOW OVERHANGS AND SUNSHADES
The Window Overhangs and Sunshades section focuses on designing shading systems to optimize solar heat gain and cooling efficiency in the greenhouse. Properly designed overhangs and sunshades can block unwanted summer sun while allowing winter sunlight to enter, reducing the need for artificial cooling and heating.
SOLAR SHADING FOR COOLING EFFICIENCY
The Solar Shading for Cooling Efficiency section explains the purpose and benefits of shading systems.
- To reduce the need for air conditioning in warm climates, properly designed window overhangs or sunshades can block unwanted summer sun while still allowing winter sunlight to enter.
- The aim is to prevent excessive solar heat gain during warmer months and promote passive solar heating in winter.
OVERHANG DESIGN GUIDELINES
The Overhang Design Guidelines section provides detailed recommendations for designing effective shading systems based on latitude and window height.
OVERHANG PLACEMENT FOR LATITUDE:
The Overhang Placement for Latitude section highlights the importance of aligning shading systems with the sun’s path.
- The effectiveness of an overhang is largely dependent on the latitude of the project site. In northern latitudes (the Northern Hemisphere), solar glazing faces south, while in southern latitudes, it faces north.
- Overhangs are designed to shade windows from high-angle summer sunlight while allowing lower-angle winter sunlight to enter.
OVERHANG SIZING:
The Overhang Sizing section outlines the proportional sizing of overhangs based on latitude and window height.
The size of the overhang should be proportional to the height of the window opening, based on latitude. The further you are from the equator, the larger the overhang required:
- 1/4 the height of the opening at latitudes of 28°–32°
- 1/3 the height of the opening at latitudes of 36°–40°
- 1/2 the height of the opening at latitudes of 44°–56°
These ratios help ensure that the overhang effectively blocks summer sunlight while allowing winter sunlight to pass through and heat the space.
HORIZONTAL LOUVERS:
The Horizontal Louvers section explores the use of louvers as an alternative or complementary shading solution.
- Exterior horizontal louvers can be employed to provide solar shading for south-facing glazing.
- Louvers should be sized according to the guidelines mentioned above, ensuring the projection length is a fraction of the distance between louvers.
- This approach allows flexibility in managing solar exposure and controlling interior temperatures.
APPLICATION FOR GREENHOUSE DESIGN
The Application for Greenhouse Design section discusses how shading strategies can be tailored to the greenhouse environment.
- For the greenhouse, shading is critical for maintaining consistent internal temperatures and reducing cooling loads during warmer months.
- By employing these overhang and louver strategies, you can minimize unwanted heat gain, ensuring that the greenhouse stays cooler and that artificial cooling is minimized.
- However, it is equally important to avoid blocking the sunlight during colder months to maintain warmth, especially given the passive solar design of the greenhouse.
- In climates where heating is not required, extend the overhangs or shading devices to cover the entire solar façade and adjacent outdoor spaces, fully blocking the sun’s rays to prevent overheating in the greenhouse.
SUMMARY
By designing window overhangs and sunshades based on latitude and window height, the greenhouse can effectively manage solar heat gain, reducing the need for artificial cooling in summer and promoting passive solar heating in winter. These strategies ensure a stable and energy-efficient environment for optimal plant growth.
CLIMATE-RESPONSIVE CONSTRUCTION
The Climate-Responsive Construction section focuses on strategies to regulate internal temperatures using natural methods, such as thermal mass and night vent cooling. These approaches are particularly effective in climates with significant diurnal temperature variations, reducing the need for energy-intensive cooling systems.
NIGHT VENT COOLING STRATEGY FOR THERMAL MASS
The Night Vent Cooling Strategy for Thermal Mass section explains how to use cool night air to regulate indoor temperatures.
- In hot, dry climates, night vent cooling can be an effective strategy to regulate internal temperatures without relying on active cooling systems.
- This approach works by using cool night air to flush out the heat absorbed by thermal mass (e.g., concrete, masonry, or adobe) during the day.
- By cooling the thermal mass at night, the structure remains cooler throughout the next day, even as outdoor temperatures rise.
- This is particularly relevant for climates with a significant diurnal temperature difference of at least 11°C (20°F) or more.
GUIDELINES FOR THERMAL MASS IN CLIMATE-RESPONSIVE DESIGN
The Guidelines for Thermal Mass in Climate-Responsive Design section provides detailed recommendations for incorporating thermal mass into the greenhouse design.
THICKNESS AND SURFACE AREA OF THERMAL MASS:
The Thickness and Surface Area of Thermal Mass section outlines the optimal dimensions for thermal mass elements.
- The thermal mass should be a minimum of 10.2 cm (4 inches) thick to provide sufficient capacity to absorb and store heat.
- The surface area of the thermal mass should be 1 to 3 times the floor area of the space it serves. More surface area leads to greater thermal stability and cooler indoor conditions.
VENTILATION FOR HEAT FLUSH:
The Ventilation for Heat Flush section emphasizes the importance of effective ventilation for night cooling.
- Effective cross or stack ventilation is necessary to ensure that the cool night air can effectively flush out the accumulated heat from the thermal mass.
- The cooled thermal mass will then release this stored coolness during the day, reducing the need for active cooling and maintaining more stable indoor temperatures.
APPLICATION FOR GREENHOUSE DESIGN
Incorporating heavy thermal mass in the design of the greenhouse can help stabilize internal temperatures and reduce the dependency on energy-intensive cooling systems. For example:
- Walls, floors, and ceilings made of concrete or masonry can act as thermal storage, especially if the greenhouse experiences significant temperature fluctuations between day and night.
- The diurnal temperature difference data from the location, as analyzed through Climate Consultant software, supports the use of night vent cooling, as night temperatures drop significantly below daytime highs.
- By ventilating the greenhouse at night using passive systems, such as cross ventilation or stack ventilation, heat can be efficiently flushed out of the thermal mass, maintaining cooler indoor environments during the day, even in the height of summer.
MINIMIZE BUILDING SIZE
The Minimize Building Size section emphasizes the importance of reducing the building’s footprint to enhance energy efficiency.
- A smaller footprint reduces the energy required for heating, cooling, and lighting.
- This strategy ensures that the greenhouse operates efficiently while minimizing resource consumption.
HIGH-EFFICIENCY HEATING SYSTEMS
The High-Efficiency Heating Systems section highlights the benefits of using advanced heating technologies.
- Employ high-efficiency heaters or boilers to reduce energy consumption.
- These systems provide effective heating while lowering operational costs and environmental impact.
LIGHTWEIGHT CONSTRUCTION FOR TEMPERATE CLIMATES
The Lightweight Construction for Temperate Climates section discusses the advantages of lightweight materials in specific climates.
- Consider lightweight construction for areas where quick heating and cooling response is needed.
- This approach is particularly effective in temperate climates, where rapid temperature adjustments are necessary to maintain comfort and energy efficiency.
EARTH SHELTERING
Earth sheltering can be a highly effective strategy for maintaining stable internal temperatures in a greenhouse, particularly in climates with extreme temperature fluctuations. By utilizing the natural insulating properties of the earth, this method reduces heating and cooling loads, protects the structure from environmental stressors, and offers additional benefits such as noise reduction and habitat preservation.
KEY CONSIDERATIONS FOR EARTH SHELTERING IN GREENHOUSES
The Key Considerations for Earth Sheltering in Greenhouses section outlines the critical factors to ensure the success of earth-sheltered designs.
THERMAL BUFFERING:
The Thermal Buffering section explains how earth sheltering stabilizes internal temperatures.
- Earth sheltering helps to buffer the greenhouse from external temperature swings by using the earth as insulation. This is particularly effective in climates with significant differences between daytime and nighttime temperatures.
- Reduced Heating Load: In cold climates, earth-sheltered structures retain warmth during the night, significantly lowering the heating requirements during colder months.
WATERPROOFING AND DRAINAGE:
The Waterproofing and Drainage section highlights the importance of moisture management in earth-sheltered designs.
- For earth-retaining structures, continuous waterproof barriers are essential to prevent water intrusion. These should be comparable to waterproofing systems used in green roofs or swimming pool construction to ensure durability.
- To prevent moisture-related issues such as mold and condensation, indoor air circulation must be prioritized, particularly in areas prone to high humidity.
- Ensuring the greenhouse is above groundwater level is critical to avoiding flood risks, and the design should incorporate proper drainage to divert water away from the building.
PLACEMENT OF INSULATION:
The Waterproofing and Drainage section highlights the importance of moisture management in earth-sheltered designs.
- In earth-sheltered designs, insulation is most effective when placed on the exterior face of retaining walls.
- This prevents heat loss to the surrounding earth while maintaining a comfortable temperature inside the greenhouse.
VENTILATION AND SOLAR GAIN:
The Ventilation and Solar Gain section emphasizes the need for natural ventilation and solar exposure in earth-sheltered greenhouses.
- Despite being partially underground, the greenhouse should still be oriented to take advantage of natural ventilation and maximize daylighting.
- In cold climates, orientation should also aim to maximize passive solar heat gain through southern exposure (in the Northern Hemisphere), integrating with other solar heating strategies.
APPLICATION TO GREENHOUSE
The Application to Greenhouse section explores how earth sheltering can be integrated into the Walipini greenhouse project.
- For the Walipini greenhouse project, integrating earth sheltering on the north and partially on the east and west sides can enhance thermal stability and reduce the need for active heating or cooling systems.
- Proper waterproofing, ventilation, and drainage will ensure that the structure remains dry and mold-free while taking full advantage of the earth’s thermal properties to create a more energy-efficient growing environment.
- Careful insulation placement and orientation will maximize the energy-saving potential of this design feature.
STORAGE AREAS IN COOL ZONES
The Storage Areas in Cool Zones section highlights the strategic placement of non-living spaces to enhance thermal efficiency in the greenhouse.
THERMAL BUFFERING WITH STORAGE AREAS
The Thermal Buffering with Storage Areas section explains how storage spaces can act as thermal buffers.
- Place garages or storage areas on the cooler side of the building (typically the north side in the Northern Hemisphere) to act as thermal buffers.
- These spaces help insulate the greenhouse from cold winds and temperature fluctuations, reducing the heating load and improving energy efficiency.
FLAT ROOFS
The Key Considerations for Flat Roofs in Greenhouse Design section outlines the critical factors for optimizing flat roofs in greenhouse environments.
DESIGNING FOR FLAT ROOFS IN HOT, DRY CLIMATES
The Designing for Flat Roofs in Hot, Dry Climates section explains the benefits of flat roofs and cool roof strategies in hot climates.
- Flat roofs can be highly effective in hot, dry climates by minimizing heat absorption and reflecting solar radiation.
- To enhance performance, utilize cool roof strategies, which reduce heat transfer into the structure, lower indoor temperatures, and mitigate the effects of urban heat islands.
KEY CONSIDERATIONS FOR FLAT ROOFS IN GREENHOUSE DESIGN
The Key Considerations for Flat Roofs in Greenhouse Design section outlines the critical factors for optimizing flat roofs in greenhouse environments.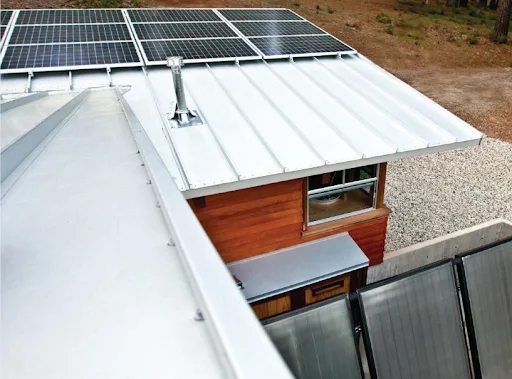
COOL ROOFS:
The Cool Roofs section highlights the importance of reflective roofing materials in hot climates.
- In hot climates or regions with intense summer heat, a light-colored roof is essential for reflecting sunlight and keeping the structure cooler.
- This not only reduces the amount of heat absorbed but also offsets CO2 warming by reflecting solar radiation back into space.
- Solar Reflectance (SR) and Thermal Emittance (TE) are critical metrics for cool roofs. A solar reflectance of greater than 0.7 and a thermal emittance of over 0.75 will ensure that the roof remains cool even on the hottest days, effectively minimizing the heat transferred to the greenhouse interior.
ENERGY EFFICIENCY:
The Energy Efficiency section discusses how cool roofs reduce cooling loads and improve sustainability.
- Cool roofs reduce cooling loads, making them highly suitable for greenhouses where maintaining a stable indoor temperature is crucial for plant growth.
- By reflecting solar radiation, cool roofs also help mitigate the urban heat island effect, which can further decrease the temperature of the surrounding environment and improve overall energy efficiency.
MATERIAL SELECTION:
The Material Selection section provides recommendations for choosing roofing materials.
- For the flat roof, choose a light-colored roofing material with high solar reflectance and thermal emittance properties, such as reflective membranes or specially coated metal roofing.
- These materials will enhance the building’s ability to stay cool by reflecting heat rather than absorbing it.
- Durability in extreme heat is another factor to consider when selecting roofing materials, as well as resistance to UV radiation.
APPLICATION TO GREENHOUSE
The Application to Greenhouse section explores how cool roofs can be integrated into the greenhouse project.
- For the greenhouse project, applying a cool roof with high solar reflectance and thermal emittance will significantly reduce the cooling demands during hot summer months.
- The roof’s ability to reflect sunlight and efficiently discharge heat will help maintain a stable indoor environment, supporting optimal growing conditions for plants.
- By mitigating excess heat gain, this strategy will also enhance the overall sustainability and energy efficiency of the greenhouse, aligning with long-term sustainability goals.
NATURAL VENTILATION STRATEGIES
The Natural Ventilation Strategies section focuses on using passive cooling methods to reduce energy consumption.
- Use a whole-house fan or natural ventilation to store ‘coolth’ at night, reducing the need for air conditioning.
- This approach leverages cooler nighttime temperatures to lower indoor temperatures during the day, enhancing energy efficiency.
TREE PLACEMENT
he Tree Placement section highlights the importance of strategic tree planting for shading and solar access.
- Avoid planting trees directly in front of passive solar windows to prevent obstruction of sunlight.
- Plant trees strategically to provide shading for windows and outdoor spaces, reducing heat gain during warmer months.
EXTRA INSULATION
The Extra Insulation section emphasizes the benefits of additional insulation for maintaining indoor comfort.
- Additional insulation can be cost-effective, helping to maintain more uniform indoor temperatures.
- This reduces the need for heating and cooling, improving energy efficiency and occupant comfort.
LIGHT-COLORED MATERIALS
The Light-Colored Materials section discusses the use of reflective materials to minimize heat gain.
- Utilize light-colored materials with high emissivity to minimize conducted heat gain.
- These materials reflect sunlight, keeping the building cooler and reducing cooling loads.
SUMMARY
The Summary section provides an overview of the design recommendations for optimizing energy efficiency and comfort.
- These points cover all the design recommendations from the guidelines provided in Figure 15.
- They offer a comprehensive approach to optimizing building design for energy efficiency, passive solar heating, cooling, and overall comfort.
RESOURCES
SUMMARY
Coming…
FREQUENTLY ANSWERED QUESTIONS
Q: Will you be getting permits for these structures?
Yes, all of our food structures will be permitted and we will be open source sharing the permitting process also.
Q: How much will these structures cost to build?
Please see our open source aquapini and walipini cost analysis page.
Q: How much food will these structures produce?
Please see our open source aquapini and walipini planting and harvesting page.
Q: What is One Community’s stance on pesticides, herbicides, and fungicides?
If it is not safe to eat, we will not be spraying it on our food.
Q: Is One Community going to be a vegetarian community?
The One Community team consists of vegans, vegetarians, and omnivores. In accordance with our philosophy for The Highest Good of All we are maintaining a non-idealogical approach to food choices. That said, also in accordance with this philosophy, we will only support and consume food items that are ethically and sustainably raised, managed, and produced. The consensus process will be used to decide the evolution of the One Community food plan.
Q: How do you intend to produce spices, mill grain for flour, produce cooking oil, etc. etc.
To us, “100% food sustainability” means we will demonstrate and open source share a model that doesn’t need external food sources. Having achieved this, what we produce internally versus choosing to buy will be decided through the consensus process.
Q: The Walipini, Aquapini, and Zenapini structures are closed-loop systems, will you be supplementing them with CO2 to improve plant growth?
Based on the research we did, we believe that we should not be concerned about the CO2 levels in our growing structures. The CO2 generated by the decomposition of organic material within these structures, from the plants themselves at night, people working in and visiting the structures, and from outside when people enter and exit will be sufficient. Recent research also showed that excessive CO2 can actually be detrimental to the nutritional value of plants. Intentional increases to 1500 ppm (for production increases of 30%) can be created by various means but this extra CO2 decreases levels of key nutrients while also creating excess carbohydrate/sugar content. This results over the long run in plants becoming more like junk food than the nutritions foundations of a healthy diet they are meant to be.